In 2026, a software engineer’s H1B lottery odds depend on wage level, not luck. The new wage-weighted system gives higher-paid roles up to 61% selection odds. Entry-level spots drop to roughly 15%. That shift rewrites the financial math for every Indian professional weighing a move to the United States. And purchasing power parity is where that math begins.
This article covers how to use purchasing power parity to compare salaries between India and the USA using real data. It breaks down what those numbers mean for software engineers and nurses, why the exchange rate misleads, and how taxes, visa costs, and city prices change the picture.
The India vs USA figures here draw on Glassdoor, the U.S. Bureau of Labor Statistics, and official World Bank purchasing power parity factors.
Whether you’re evaluating a US vs India offer or using the purchasing power parity salary calculator as a way to compare income across these two economies, this guide covers the real numbers.
PPP Salary Quick Reference : India vs USA
| Annual Salary (USD) | PPP Equivalent in India (INR) | Context |
|---|---|---|
| $60,000 | ₹12,25,319 (₹12.3 lakhs) | Entry-level tech or mid-career nurse |
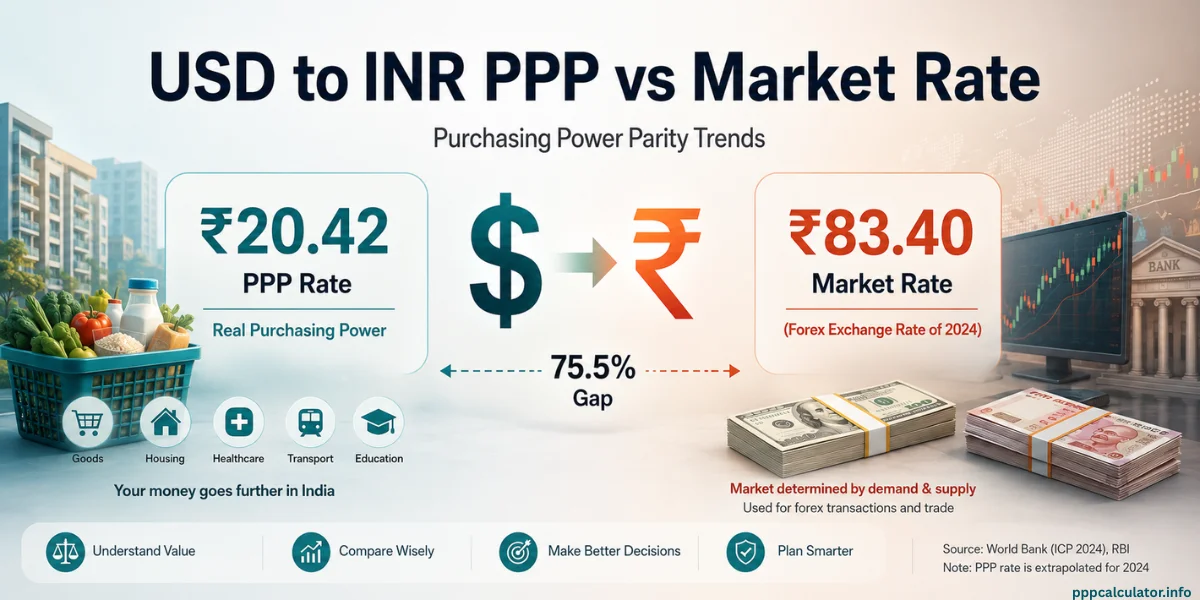
| $100,000 | ₹20,42,199 (₹20.4 lakhs) | Mid-career professional |
| $150,000 | ₹30,63,298 (₹30.6 lakhs) | Senior engineer or specialist |
| $200,000 | ₹40,84,398 (₹40.8 lakhs) | Staff or principal engineer |
These figure use the PPP factors of World Bank 2024 International Comparison Program. In macroeconomics, PPP conversion factors adjust gross domestic product and salary figures so they reflect real purchasing power rather than just currency values.
How the PPP Calculator Works for India vs USA
The purchasing power parity calculator converts your salary from one currency to another using PPP factors instead of the foreign exchange rate. Think of it as a purchasing power parity salary converter. It doesn’t tell you how many rupees your bank gives you for dollars. It tells you how much local currency is needed in the target country to buy a similar amount of goods and services.
The numbers help you understand whether a job offer in another country will actually improve your life, or just look bigger on paper.
The PPP formula is simple. Equivalent Salary equals your current salary times the Target Country PPP Factor divided by the Source Country PPP Factor. For $100,000 in the USA moving to India: $100,000 times (20.421988 / 1.00) equals ₹20,42,199.
That ₹20.40 lakhs isn’t a currency conversion. It’s the annual salary you’d need in India to maintain the same standard of living that $100,000 supports in the United States.
To use the calculator, select your current country, enter your salary, pick the target country, and read the result. The calculator works for any country pair across 196 nations.
Why the Exchange Rate and PPP Give Different Numbers

Purchasing power parity and Exchange rates answers different questions.
Exchange rates answer: how many rupees does your bank hand you? That rate reflects currency trading, interest rate changes, capital flows, and speculation. It shifts daily, and exchange rate changes can move the converted figure by lakhs in a single month.
PPP answers: how much does it cost to live a similar lifestyle in another country? That number reflects the price level of a basket of goods and services, roughly 3,000 items, tracked by the World Bank.
PPP provides a way to measure how much your money actually buys in one country versus another, which is what matters when you’re choosing where to live and work.
If you earn a US salary of $100,000 while living in India, you receive roughly ₹94 lakhs in converted USD to INR. But you only need about ₹20.40 lakhs to match your American living standards. The remaining gap is your purchasing power surplus. That’s why remote workers earning in dollars while based in India build wealth so quickly.
For a deeper look at when each measure helps or hurts your decisions, the PPP vs exchange rate guide covers scenarios where relying on the wrong one costs real money.
What Software Engineers Earn: India vs USA
PPP shows equal purchasing power between two countries. It doesn’t show what employers pay. Those are separate questions, and mixing them up leads to bad choices.
According to Glassdoor data (March 2026), a software engineer in the US earns a median total pay of about $149,000 per year. Senior engineers average around $198,000. Entry-level roles come in near $137,000.
In India, the numbers look very different. Glassdoor reports software engineers in Bangalore earn roughly ₹6.8 lakhs at entry level, ₹11 to ₹18 lakhs mid-career, and ₹23 lakhs or more at senior level. Lead engineers in Bangalore hit ₹33 lakhs median.
Use PPP convertor to compare salaries across these roles. The $149,000 US median converts to about ₹30.40 lakhs in purchasing power. A senior engineer earning ₹23 lakhs in Bangalore has roughly 76% of that purchasing power, even though the nominal salary gap looks enormous. That’s the relative purchasing power comparison at work.
But three things shift the picture. First, equity pay. US tech packages often include RSUs worth $30,000 to $150,000 per year at firms like Google or Amazon. Indian packages rarely match that scale. When you add equity, the PPP gap widens.
Second, the city matters. An engineer in San Francisco faces steeper costs than one in Austin. The national PPP factor doesn’t capture that gap. Similarly, ₹18 lakhs in Pune stretches further than the same Indian salary in Mumbai. The PPP by city guide explains how to adjust for these local cost gaps.
Third, career growth differs. US tech pay often doubles between mid and principal levels. Indian salary growth is improving at top firms but still follows a shallower curve. A five-year view changes the one-year PPP snapshot a lot.
What Nurses Earn: India vs USA
Nursing is the second most common profession for Indian immigrants to the US. The purchasing power story here looks nothing like tech. California pays the highest average at roughly $148,000, while states in the south drop closer to $60,000. Glassdoor reports total RN pay around $100,000 for 2026.
In India, registered nurses earn far less. Most hospital nurses make ₹2.5 to ₹6 lakhs. Senior nurses at top private chains like Apollo or Fortis reach ₹8 to ₹12 lakhs.
The PPP conversion: $93,600 equals about ₹19.10 lakhs in Indian purchasing power. Even a senior nurse at a top Indian hospital earning ₹10 lakhs reaches only 52% of that level. Unlike tech, where Indian salaries at top firms approach PPP parity with the US, nursing shows a persistent and large gap. The reason is market structure and competition for talent.
Productivity differences in healthcare economics also play a role: US nurses handle more complex equipment and administrative tasks, and the economic productivity of the US healthcare sector commands higher wages across the board.
For an Indian nurse weighing the US, the math usually works out well after visa costs, licensing exams (NCLEX-RN and CGFNS), and relocation. But it takes time. Most nurses need 18 to 30 months to clear US licensing, and the EB-3 visa pathway can run three to five years.
The H1B Visa Question in 2026
No India vs USA salary comparison is complete without the visa piece. Immigration costs and odds reshape the financial outcome entirely.
Since February 2026, the H1B uses a wage-weighted lottery. Higher wage levels get more chances. DHS projects Level IV roles (top pay) have about 61% selection odds. Level I (entry pay) drops to roughly 15%. The old random system gave everyone about a 30% shot.
In practice, if your offer lands at Wage Level II or III for your job and metro area, your odds sit between 31% and 46%. A Level IV offer roughly doubles your chances compared to Level I.
There’s also a $100,000 additional fee on certain H1B petitions, introduced by presidential proclamation. Total H1B costs with legal fees, premium processing, and the new fee can top $15,000 to $20,000. Employers pay these, but they factor into compensation talks.
Consider someone earning ₹25 lakhs in Bangalore with a US offer of $130,000. PPP says that’s roughly equal ($130,000 converts to about ₹26.50 lakhs). But add the H1B uncertainty at maybe 35% odds, the 18-month wait, and the tie to one employer for sponsorship, and the expected value drops a lot.
PPP gives you the baseline to compare your salary. The visa system decides whether you can access it.
The India to Canada corridor has a very different immigration story. If you’re weighing both options, the India vs Canada comparison covers Express Entry and PR pathways. For the UK route, the India vs UK guide covers Skilled Worker visa details.

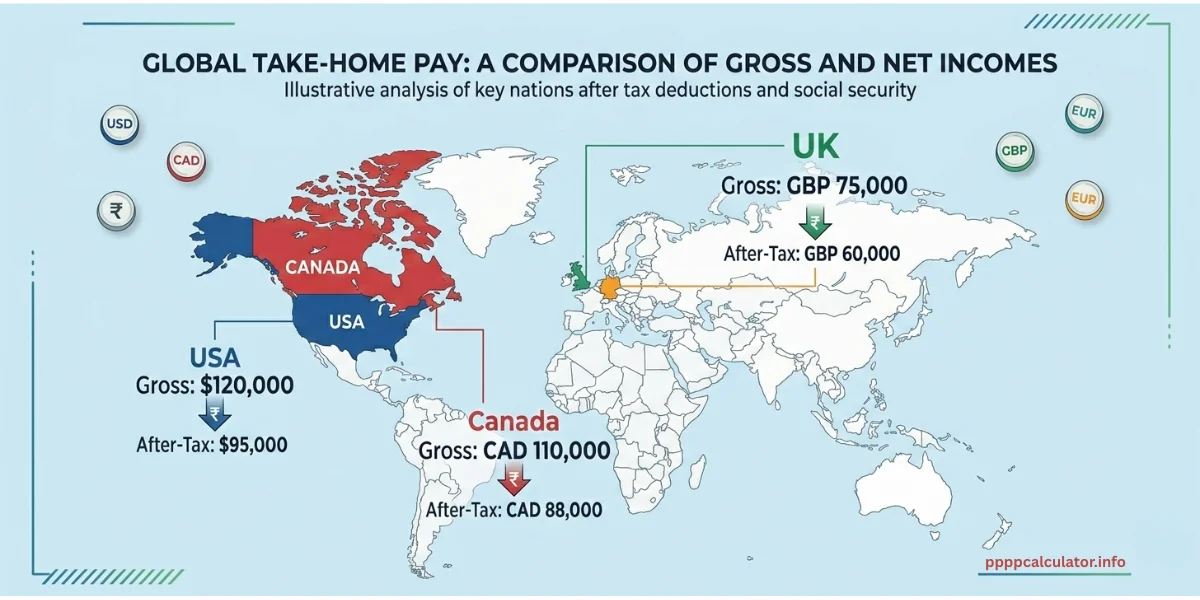
Taxes Cut the PPP Number
Purchasing parity compares gross salary. Nobody lives on gross pay. Tax structures in India and the US differ a lot, and skipping this step gives a misleading picture.
On a $100,000 US salary, federal tax takes roughly $15,000 to $18,000. Add Social Security and Medicare at 7.65% ($7,650), plus state tax. A single filer in California earning $100,000 takes home about $68,000 to $72,000. In Texas or Florida, with zero state tax, take-home rises to around $74,000.
In India, the new tax regime on ₹20 lakhs produces roughly ₹3.5 to ₹4 lakhs in tax. Take-home pay lands near ₹16 to ₹16.5 lakhs.
The after-tax PPP comparison changes things. Your $100,000 US salary, after taxes, leaves about $70,000 in spending power. The PPP equivalent of $70,000 in India is roughly ₹14.30 lakhs, not the ₹20.40 lakhs from the gross figure. That’s a 30% drop from the headline PPP number.
And then there are benefits. Most US employers cover 70 to 80% of health insurance premiums, contribute 3 to 6% to retirement via 401(k) matching, and provide paid leave. Those add $15,000 to $30,000 in value beyond the base salary number. These benefit differences between countries mean you need to look at total compensation, not just the paycheck.
The after-tax PPP comparison walks through full gross-to-net calculations for the India to US, Canada, and UK corridors.
Three Scenarios: When the US Move Makes Financial Sense
Senior Engineer, 8+ Years
You earn ₹35 lakhs in Bangalore. A US employer offers $165,000 in Seattle. Purchasing power parity says $165,000 equals about ₹33.70 lakhs in purchasing power. On paper, that’s a slight cut.
But Seattle has no state tax, so after-tax purchasing power is higher. The offer likely includes RSUs worth $30,000 to $60,000, pushing total comp well past equivalence. And US tech pay at senior levels grows steeply. Within two to three years, a level bump could push total comp to $250,000 or more.
The case is strong if you land the H1B at Level III or IV, which $165,000 in Seattle likely qualifies for.
Mid-Career Nurse Weighing US Options
You earn ₹6 lakhs at a private hospital in Chennai. A US hospital offers $75,000 in Houston. The PPP equivalent of $75,000 is ₹15.30 lakhs, over double your current purchasing power.
Houston has no state tax, and the hospital provides insurance and pension. After federal taxes, your take-home of about $58,000 still delivers a big jump. Even after NCLEX prep costs and immigration fees, the return is strong within two to three years.
The Return-to-India Decision
You earn $120,000 in Chicago with five years of US experience. An Indian multinational offers ₹28 lakhs. PPP converts $120,000 to about ₹24.50 lakhs. The ₹28 lakh offer exceeds PPP parity by 16%.
Add the lower Indian tax rate, no healthcare premiums, and domestic help at costs that don’t exist in the US, and lifestyle comparison favors India. However, if your US package includes $40,000 in equity, total comp of $160,000 converts to ₹32.70 lakhs in PPP. At that point, ₹28 lakhs falls short.
Stock compensation is often the hidden factor that changes the decision on whether to stay or return.
What PPP Doesn’t Tell You About India – US
The purchasing power parity calculator is a starting point, not a full answer. Several things that matter to this corridor sit outside what any salary converter can measure.
Healthcare works differently in each country. US employer insurance covers most costs, but deductibles, copays, and surprise bills remain real risks. Indian private hospitals at Apollo or Max cost a fraction of US rates, but quality varies between cities.
GDP per capita gaps between the two countries partly explain why healthcare is priced so differently, but your actual experience depends on coverage and location. Unlike the consumer price index, which tracks price changes over time in one country, PPP helps you measure how much a salary buys across borders. It captures the cost of the standard basket but not the quality differences in what you receive.
Housing markets run on different logic. Buying property in India, even in costly cities like Mumbai, takes a smaller share of annual salary than in San Francisco. Inflation rates, rental yields, and mortgage terms all differ.
A $150,000 earner in the US may struggle to buy a home in a major metro. A ₹30 lakh earner in India has realistic options in Bangalore or Hyderabad.
Career flexibility matters too. The US has a broader market for switching jobs, especially in tech and healthcare. But until you hold a green card, your residency ties to your employer.
Living in India gives you that freedom to change jobs without immigration risk. The PPP Comparisons hub covers several other corridors if you’re weighing destinations beyond the US.
Social infrastructure is hard to quantify. US public schools are free and often strong. India’s public school system pushes most middle-class families toward private options at ₹1 to ₹5 lakhs yearly. But eldercare is far more accessible and affordable in India.
These factors don’t show up in any basket of goods and services calculation, yet they weigh heavily in the decision to move between countries.
How to Use PPP with Other Tools for a Full Picture
No single tool gives you the complete answer. Here’s how to combine several for an accurate comparison of your salary across countries. A salary conversion based on PPP alone only captures part of the picture, but pairing it with other tools helps you get a more accurate result.
- Start with the PPP calculator to convert your salary from one currency to another using the concept of PPP Data. Think of it as a PPP salary converter rather than a currency converter. This baseline tells you what you’d need in the other country to maintain a similar quality of life.
- Next, use SalaryAfterTax.com to check take-home pay in both places. Different countries tax income at very different rates. The gap between gross PPP and net PPP can run 20 to 30%.
- Then check Numbeo for city-level data. PPP works at the national level, but if you’re comparing Bangalore to San Francisco, local cost data matters more. The cost of living calculator guide explains where PPP and Numbeo agree, where they split, and why.
Finally, look up profession-specific pay on Glassdoor or Levels.fyi. Any salary calculator can tell you what an equivalent figure would be. But Glassdoor tells you what employers pay for your role in practice. If actual pay exceeds the PPP figure, the move lifts your living standards. If it falls short, the different purchasing power between the two countries doesn’t help you because you can’t access it at that salary level.
Using these tools together helps you understand how much you really need in the other country to keep your lifestyle. They help you compare your salary in context, not just by taking into account the exchange rate but also by factoring in taxes, city costs, and what employers actually pay for your job.
If you’re weighing a move from the US to India or comparing an offer in the United States dollar against an INR package, this combined approach gives you the complete picture.
The salary converter guide runs this exact exercise across common corridors. For a broader look at what purchasing power parity means and where it falls short, that guide covers the full concept.
PPP Calculator India vs USA – FAQ
In purchasing power, they’re roughly equal. The World Bank PPP factor converts $100,000 to about ₹20.40 lakhs. It means ₹20.40 lakhs in India buys a comparable basket of goods to what $100,000 buys in the US. After taxes, the gap shifts because US tax on $100,000 typically eats a larger share than Indian tax on ₹20 lakhs.
No, currency conversion doesn’t measure living costs. Because, prices of goods are lower in India, the PPP-adjusted figure based on purchasing power, is the right benchmark. Using different currencies at market rates only tells you what your bank transfers, not what your money buys.
No, PPP only compares the cost of goods and services. It doesn’t include immigration costs, processing times, or visa odds. The H1B process in 2026 can add $15,000 to $20,000 in costs, plus months of waiting.
India’s service economy stretches high earners further. Domestic help, drivers, medical and cooks cost is cheaper in India. That expense doesn’t exist in the US at any income. These service differences make living in India on ₹25 lakhs feel richer than the PPP number alone predicts.

Jitender is the founder and lead developer of PPPCalculator.info. He created this free tool to bridge the gap between currency conversion and real purchasing power, helping professionals across 50+ countries make informed salary decisions. He regularly translates complex World Bank and OECD data into practical guides for remote workers and expats.