For every $1 earned in the United States, you need just £0.66 in the United Kingdom to maintain the same buying power. A $100,000 American salary has the same purchasing power as£66,415 in the UK. Try the PPP Calculator USA vs UK above with your own figures.
USD to GBP PPP Salary Equivalents
| US Salary (USD) | UK PPP Equivalent (GBP) |
| $50,000 | £33,208 |
| $75,000 | £49,811 |
| $100,000 | £66,415 |
| $125,000 | £83,019 |
| $150,000 | £99,623 |
Source: World Bank 2024 PPP conversion factors. US factor: 1.00, UK factor: 0.664153.
What This Salary Comparison Means?
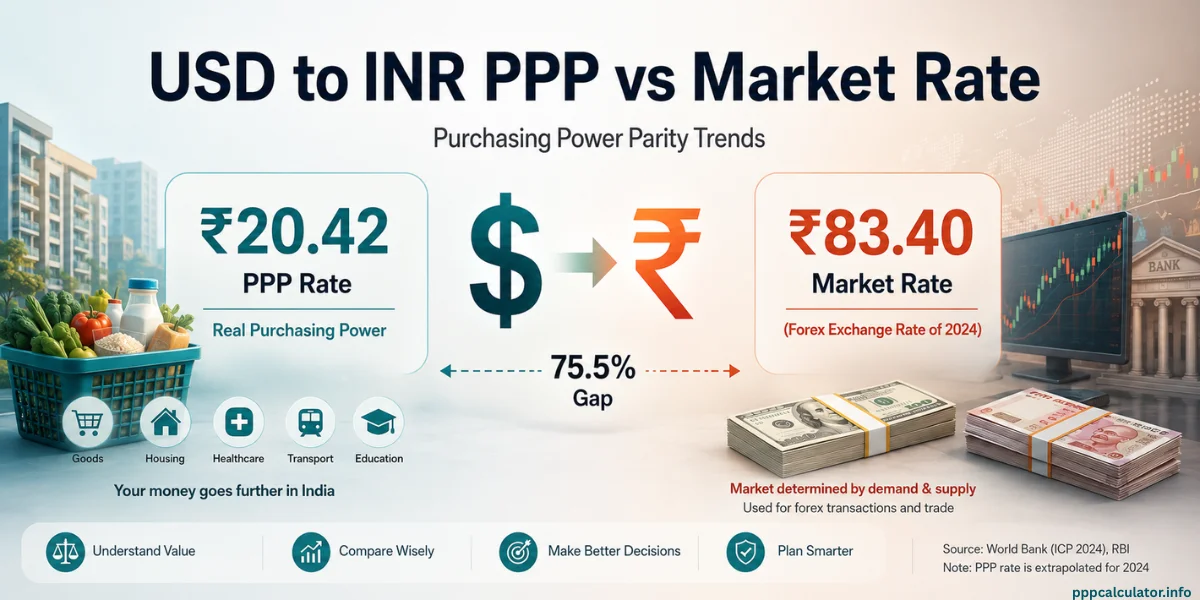
The gap between exchange rate and purchasing power parity tells you something important here. At the market exchange rate, $100,000 converts to roughly £79,000. But the price parity adjustment says you only need £66,415 for the same lifestyle. Everyday costs in the UK stretch further than currency conversion suggests.
Healthcare is where the difference really shows. An American spending $7,000 to $12,000 a year on insurance premiums and deductibles won’t face that cost in the UK. The NHS covers treatment through taxes already deducted from your salary. That alone can shift the real value of a UK offer by several thousand pounds compared to what the raw salary comparison number shows.
USA vs UK – Key PPP Facts
| Metric | Value |
| PPP Factor (USA) | 1.000000 |
| PPP Factor (UK) | 0.664153 |
| Data Source | World Bank International Comparison Program |
| Data Year | 2024 (latest available release) |
PPP Calculator USA vs UK – FAQs
The conversion factor is 0.664, meaning $1 in the US equals £0.66 in real buying power. That’s lower than the market exchange rate of roughly £0.79. Prices for housing, groceries, and services in the UK tend to be lower relative to the dollar than currency markets reflect.
A $100,000 US salary equals £66,415 when adjusted for purchasing power, based on World Bank 2024 data. The exchange rate would give you roughly £79,000. But price parity accounts for the fact that goods and services cost less in the UK than the currency conversion implies.
No. PPP compares national price levels across entire economies using hundreds of goods and services. Cost of living focuses on what you actually spend in a specific city. London rent averages £2,273 a month in 2026 (ONS data), far above the UK national average of £1,374. A national salary equivalence figure won’t capture that kind of city-level gap in either country.
Related Comparisons
Compare salaries across other popular corridors using the PPP salary converter:
- India vs USA Salary comparison – INR to USD purchasing power
- India vs Germany Salary comparison – INR to EURO purchasing power
- India vs Dubai Salary comparison – INR to AED purchasing power
- PPP Calculator India vs Other Countries in 2026

Jitender is the founder and lead developer of PPPCalculator.info. He created this free tool to bridge the gap between currency conversion and real purchasing power, helping professionals across 50+ countries make informed salary decisions. He regularly translates complex World Bank and OECD data into practical guides for remote workers and expats.