What is Purchasing Power Parity Calculator
A standard exchange rate only tells you the value of a currency, but a Purchasing Power Parity (PPP) calculator tells you what that money can actually buy on the ground.
PPP Calculator is a practical tool designed to bridge the gap between a raw salary figure and your real-world standard of living. By entering your current pay, your home country, and your target destination above, the calculator instantly reveals the equivalent salary you would need to maintain your exact same lifestyle abroad.
Popular Salary Equivalents Using The PPP Calculator
These figures come from World Bank PPP Conversion factors (latest available 2024 release). Each number is based on purchasing power parity factor.
Popular Earnings Equivalents
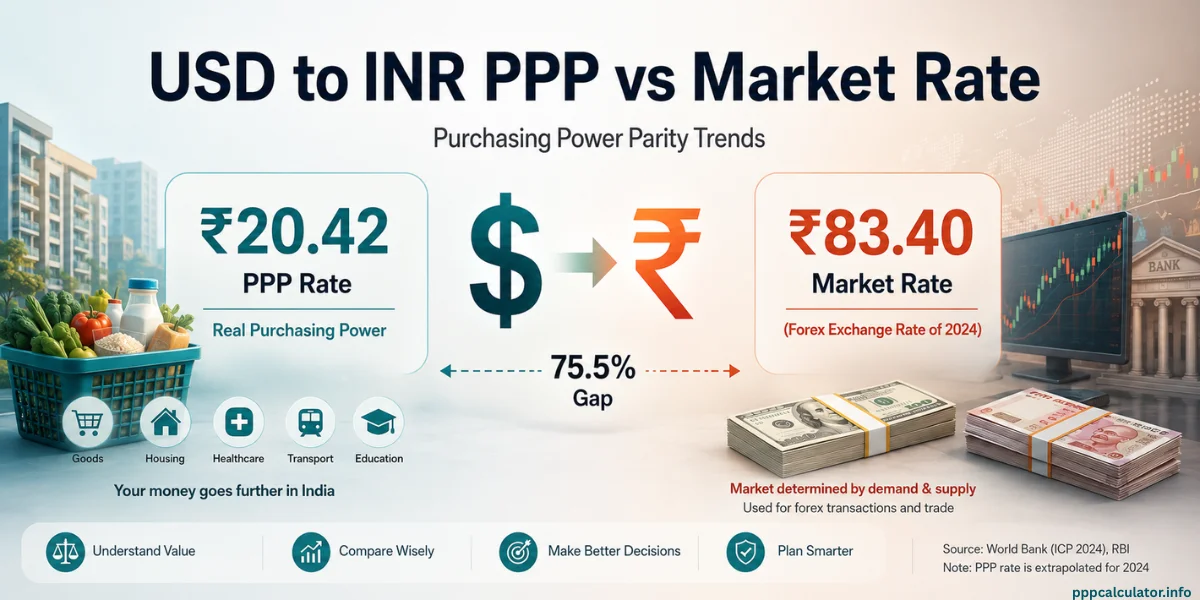
🇮🇳 India | 20.42 | INR20,42,199 |
🇬🇧 United Kingdom | 0.664 | GBP66,415 |
🇨🇦 Canada | 1.150 | CAD115,047 |
🇦🇪 United Arab Emirates | 2.330 | AED233,033 |
🇩🇪 Germany | 0.701 | EUR70,086 |
🇦🇺 Australia | 1.367 | AUD136,653 |
🇳🇱 Netherlands | 0.731 | EUR73,142 |
Popular Salary Comparisons
Explore our most searched international corridors. We break down real salary examples, hidden local costs, and actual purchasing power so you can compare job offers apples-to-apples.

Purchasing Power Parity India Vs USA in 2026
In 2026, a software engineer’s H1B lottery odds depend on wage level, not luck. The new wage-weighted system gives higher-paid roles up to 61% selection
India vs Dubai – Tax-Free Income Comparison in 2026
Last summer, a Reddit post from a 25-year-old software engineer went viral for a simple reason: he proved that his AED 10,000 monthly salary in Dubai left him

USA vs UK PPP Salary Comparison 2026
For every $1 earned in the United States, you need just £0.66 in the United Kingdom to maintain the same buying power. A $100,000 American salary has the same purchasing
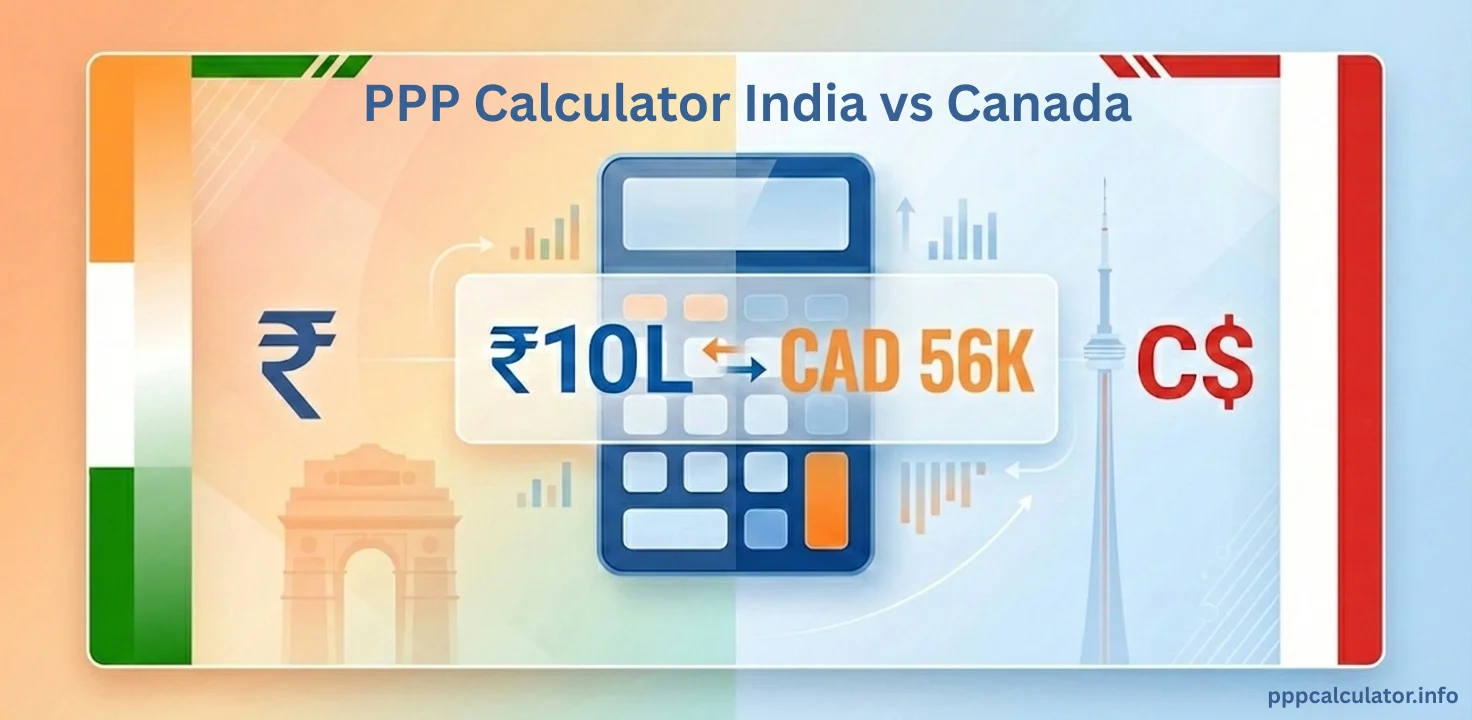
India vs Canada PPP Salary Comparison in 2026
Quick Reference: What Canadian Salary Matches Your Indian Salary? Indian Annual Salary Equivalent Canadian Salary Needed ₹8,00,000 (₹8 lakhs)
Purchasing Power Parity Concepts`
Explore purchasing power parity fundamentals i.e. the core PPP concepts in easy to understand language. No economics degree needed. No complex jargon.

Pay Parity vs Purchasing Power Parity: A Complete Comparison
Pay Parity vs Purchasing Power Parity is an interesting battle, HR teams running global compensation reviews routinely mix up two concepts that sound related but answer completely different questions. Pay …
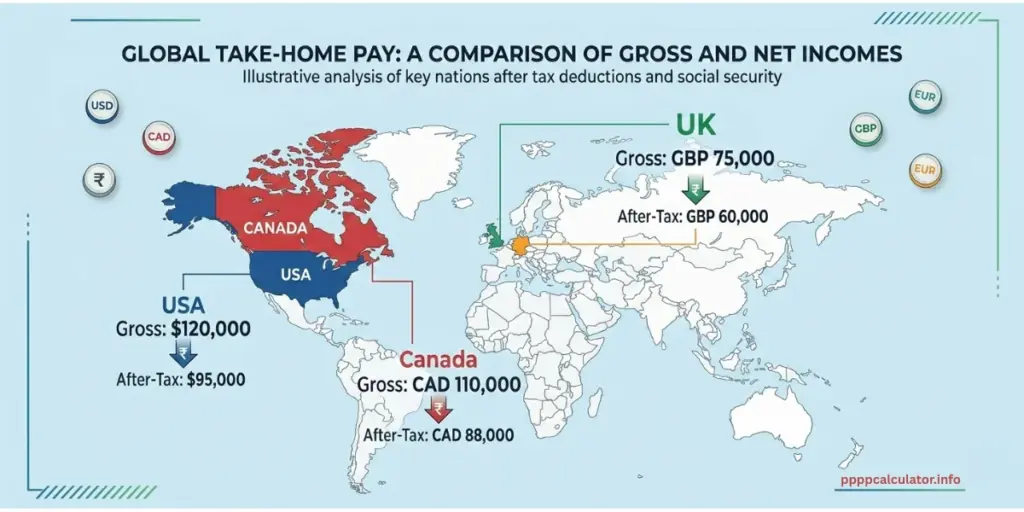
PPP Salary After Tax: India vs USA, UK, Canada & Germany
A USD 100,000 salary in the United States looks like Indian rupees 20.2 lakhs when you run it through the PPP calculator. The actual take-home after federal income tax and …

Purchasing Power Parity Formula : How to Calculate PPP
The purchasing power parity formula is one line of math. Two numbers, one division, one multiplication, done. But the simplicity hides something important: the same formula produces meaningfully different results …
FAQ – Purchasing Power Parity Calculator
A PPP calculator converts a salary from one country’s currency to another based on what each currency actually buys locally, not the market exchange rate. It uses World Bank International Comparison Program data covering 3,000 goods and services across 190+ countries, applying the formula: salary ÷ source country PPP factor × target country PPP factor.
Exchange rates reflect currency trading; PPP reflects local prices for rent, food, and services. The gap can be 4x or more. $100,000 at the market rate equals ₹94.73 lakhs (USD/INR ≈ 94.73), but the PPP equivalent is only ₹20.2 lakhs (World Bank 2024 factor: 20.20), because everyday costs in India are far lower.
PPP gives a country-level baseline accurate to roughly ±15–20%, but it ignores taxes and city-level cost differences. For a Berlin vs Munich or Mumbai vs Bangalore comparison, pair PPP with city-level data from Numbeo and post-tax figures from SalaryAfterTax.com.
No, PPP measures gross purchasing power only. Tax differences can change the result significantly — for example, a £100,000 UK salary loses 32% to income tax and National Insurance, while an equivalent ₹35 lakhs in India under the new regime loses 25%, narrowing the real take-home gap by several percentage points.
The World Bank releases new PPP conversion factors annually through its International Comparison Program (ICP), with the most recent benchmark being 2024 data published in 2025. Major ICP rounds with full price surveys occur every six years, the last full round was 2017, and the next is scheduled for 2026. Between major rounds, factors are extrapolated using GDP deflators.