A company offers you $75,000 to work remotely from Lisbon instead of $100,000 in San Francisco. Your instinct says that’s a 25% pay cut. Your currency app says the euros are worth even less. Both are wrong.
Run those numbers through a purchasing power parity comparison and the Lisbon salary buys you more. Better apartment, more restaurant dinners, probably a shorter commute. That’s what purchasing power parity reveals. It matters more than exchange rates for anyone weighing an international job, a relocation, or a remote salary negotiation.
In this guide, you’ll learn exactly what is purchasing power parity, why it matters for your financial decisions, and how to use it when comparing salaries or planning international moves.
What Purchasing Power Parity Tells You
Purchasing power parity is an economic measure that compares the real value of money across countries. It tracks what identical goods and services actually cost in each location.
The World Bank prices roughly 3,000 items across 196 countries. Bread, bus tickets, doctor visits, rent, everything. Then it boils the whole thing down to a single conversion factor per country. The United States gets a factor of 1.00 as the baseline. Everyone else is measured against it.
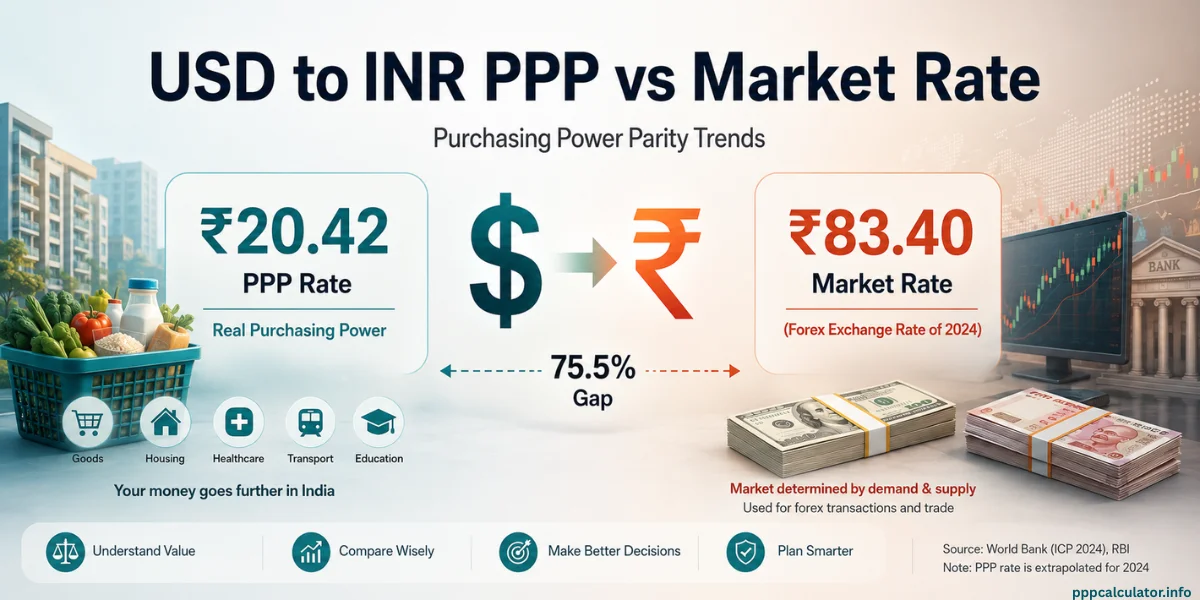
Germany’s factor is 0.73. France is 0.71. Spain is 0.58. The UK is 0.68. Canada is 1.14. Australia is 1.37. India is 20.20.
Those numbers tell you how many units of local currency buy the same basket of goods that one US dollar buys in America. Not what the currency trades for at a bank. What it purchases in a grocery store, a landlord’s office, and a hospital.
The difference between those two things can be absurd. India’s market exchange rate is around 83 to 87 rupees per dollar. Its PPP factor is 20.20. That’s a four to one gap. The gap between PPP and exchange rates is often the difference between a smart career move and a financial disaster. Even within Europe, PPP reveals gaps that exchange rates hide completely because several EU countries share the euro but have wildly different price levels.
PPP tells you what money buys at the country level before taxes. It knows nothing about your city, your tax bracket, your spending habits, or whether the apartment it calls “standard” has reliable hot water.
The PPP Salary Comparison Formula
The purchasing power parity formula is simpler than you’d expect.
Equivalent Salary = Your Salary × (Target Country PPP Factor ÷ Source Country PPP Factor)
That’s it. Every calculation on pppcalculator.info runs on World Bank 2023 conversion factors. Here’s what the formula produces for $100,000 across several countries.
| Salary | From | To | PPP Equivalent | What That Actually Means |
|---|---|---|---|---|
| $100,000 | USA | Spain | €58,371 | Spain is significantly cheaper in real terms |
| $100,000 | USA | Germany | €72,810 | Germany’s cheaper than the exchange rate suggests |
| $100,000 | USA | France | €71,057 | Almost identical to Germany in purchasing power |
| $100,000 | USA | UK | £68,291 | The pound goes further than the dollar for daily spending |
| $100,000 | USA | Canada | CAD $113,731 | Canada is a bit pricier, not the bargain people assume |
| $100,000 | USA | India | ₹20,20,256 (≈ ₹20.2 lakhs) | The rupee stretches far in local purchasing power |
| $100,000 | USA | Australia | AUD $136,920 | Australia’s high costs show up immediately |
Look at the European numbers. Spain at €58,371, Germany at €72,810, and France at €71,057 all use the euro, but their purchasing power is nothing alike. Your money goes roughly 25% further in Madrid than in Munich for the same basket of goods. PPP captures this. An exchange rate never would, because the exchange rate between eurozone countries is, by definition, 1 to 1.
That Canada number surprises people too. Everyone assumes Canada is significantly cheaper than the US. In PPP terms, it’s slightly more expensive.
The PPP calculator handles any corridor without needing US dollars as a middle step.
Where PPP Actually Helps
For comparing salaries across countries at a high level, nothing beats PPP. Numbeo is crowdsourced and unverified. Expatistan covers fewer cities. Exchange rates tell you what traders think, not what bread costs.
The World Bank’s methodology is documented, peer reviewed, and covers 196 countries. Whether you’re evaluating an offer in Germany, Canada, Australia, or anywhere else, PPP is where you start.
Companies like GitLab and Buffer built their remote compensation frameworks on geographic adjustment factors modeled after PPP. The salary comparison by country guide covers how different tools approach this and why they produce different answers.
But PPP is the best starting point, not the finishing point. Most articles about PPP stop at “it’s useful, it has limitations, the end.” That’s useless if you’re actually trying to make a decision.
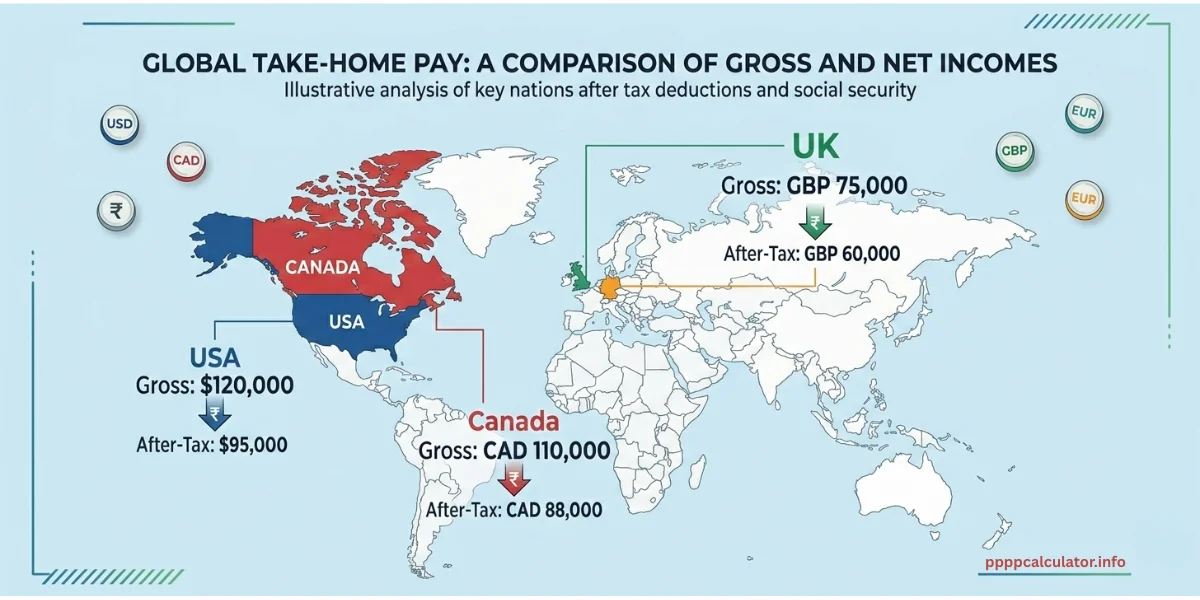
Taxes Will Flip Your PPP Result
Say you’re earning €45,000 in Madrid and you get an offer for €70,000 in Amsterdam. PPP says the Dutch salary is equivalent to roughly €53,400 in Spanish purchasing power. Still better than your current €45,000, right? Maybe. But the Netherlands takes a much bigger tax bite than Spain at that income level.
Once you compare after tax take home pay in PPP adjusted terms, the gap between the two offers might be smaller than you think. Or it might disappear entirely.
PPP ignores taxes completely. Every PPP number is gross. Germany eats 35 to 45% of a mid range salary in income tax and social contributions. Spain’s effective rate at similar income levels is lower. India might take 15 to 20%. Dubai takes nothing.
Two salaries that look identical in the PPP calculator produce completely different bank account balances.
The after tax PPP article on this site runs the complete gross to net PPP calculation for several corridors. For one of them, taxes cut the PPP advantage nearly in half. SalaryAfterTax.com handles the tax step for most countries.
Your City Isn’t Your Country
Would you trust a single number that treats Madrid and Seville as the same place? Or Barcelona and Cáceres? PPP does exactly that. Spain gets one factor. But rent for a two bedroom apartment in central Barcelona runs roughly double what you’d pay in Seville or Valencia for comparable space.
Every country has this problem. Paris and Toulouse share France’s 0.71 factor despite a massive cost gap. Munich and Leipzig share Germany’s 0.73. London costs 30 to 50% more than the rest of the UK. Mumbai and Jaipur are different financial planets.
If you’re moving to an expensive city, PPP makes your destination look cheaper than it is. Moving to a smaller city, it understates how far your money goes. World Bank data doesn’t exist at the city level.
The PPP by city guide explains why and shows what you can do instead. Numbeo fills some of this gap with crowdsourced city prices, though its data quality varies wildly by location.
PPP Treats All Quality as Equal
In the World Bank’s basket, a 600 square foot Mumbai flat with intermittent water counts the same as an 800 square foot Munich flat with central heating. Both are “standard apartment.” PPP calls them equivalent. They’re not.
This matters most when you’re comparing countries with very different infrastructure. Healthcare is a good example. PPP says a doctor visit in India and one in the US are comparable line items. The price gap is real. But if you have a chronic condition or young kids, the quality and accessibility of that healthcare might matter more than the price.
Same with schools, public transport, and legal protections for workers. PPP measures the cost of living. It doesn’t measure the experience of living.
How to Actually Use PPP Without Getting Fooled
PPP is step one of three, not the whole answer.
Start with the PPP calculator. Get the gross purchasing power equivalent. That’s your baseline.
Then go to SalaryAfterTax.com and run the tax calculation for both countries. The after tax PPP number is the one that matters for your bank account.
After that, open Numbeo and compare your specific cities. PPP gives you the country picture. Numbeo gives you the city picture. Together they’re far more accurate than either one alone. The cost of living calculator comparison runs the same salary through multiple tools and shows where they agree and where they split.
If you’re comparing a specific job offer, add one more layer. Pull up Glassdoor or Levels.fyi and check whether that salary is competitive for your role in the destination market. PPP tells you what a salary is worth. It can’t tell you whether the offer is fair.
How PPP Stacks Up Against Other Tools
| Tool | What It Measures | Data Source | Best For | Biggest Weakness |
|---|---|---|---|---|
| PPP Calculator (World Bank) | What your money buys in another country | Government price surveys, 196 countries | Country level salary comparisons | National averages only, ignores taxes |
| Numbeo | Relative living costs between cities | Crowdsourced, user submitted | City level expense planning | Data quality varies, unverified |
| Expatistan | Cost of living between specific cities | Crowdsourced, smaller dataset | Quick city pair comparisons | Limited coverage, no salary layer |
| SalaryAfterTax.com | Take home pay after taxes | Tax code data per country | Understanding your net income | No purchasing power adjustment |
| Glassdoor / Levels.fyi | Role specific salary benchmarks | Employee self reported data | Checking if an offer is competitive | Not available for all countries |
No single tool gives the full picture. PPP for the baseline, SalaryAfterTax for taxes, Numbeo for city reality, and Glassdoor for role context. Stack them.
What About the Big Mac Index?
It’s the most famous shorthand for purchasing power parity, but it’s not a serious tool. The Economist’s Big Mac Index compares burger prices worldwide. A Big Mac runs about $5.69 in the US, $2.34 in India, and $7.73 in Switzerland. Same sandwich. Completely different prices.
It tracks one product from one company. The full PPP basket covers thousands of items weighted by actual spending patterns. Where the two disagree sharply for a country, that gap usually points to trade barriers, agricultural subsidies, or unusual fast food pricing.
For salary decisions, use the full methodology through the PPP Concepts hub. The Big Mac is a conversation starter, not a calculator.
What is Purchasing Power Parity – FAQ
PPP alone can’t answer that. Germany and France have almost identical PPP factors (0.73 vs 0.71), so the gross purchasing power looks like a win for Berlin. But German income tax and social contributions take a bigger bite than French ones at that salary level. And Berlin rent has climbed sharply while Lyon remains relatively affordable.
Exchange rates react to currency traders and central bank decisions. PPP factors track what groceries and rent and doctor visits actually cost on the ground. Those prices shift slowly. The World Bank updates its factors annually.
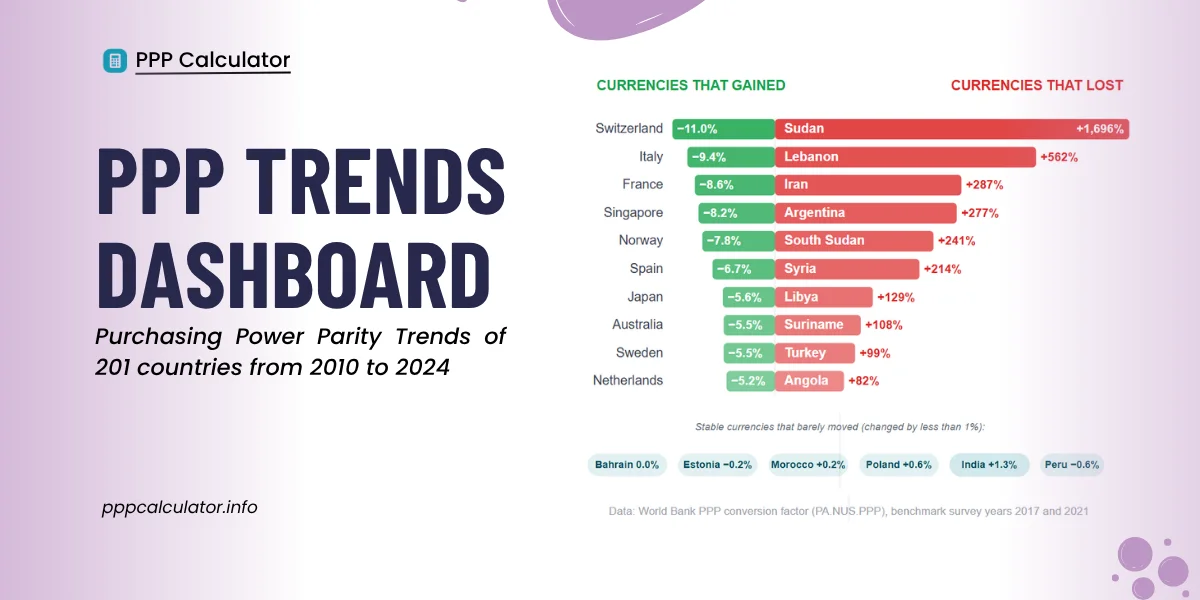
PPP works best between economies with stable inflation and solid participation in the World Bank’s surveys. For countries with rapid inflation (Argentina, Turkey), dual exchange rates, or huge informal economies, the factor can lag reality by months. For Western Europe, North America, Australia, Japan, India, and most of East Asia, the data is solid.

Jitender is the founder and lead developer of PPPCalculator.info. He created this free tool to bridge the gap between currency conversion and real purchasing power, helping professionals across 50+ countries make informed salary decisions. He regularly translates complex World Bank and OECD data into practical guides for remote workers and expats.