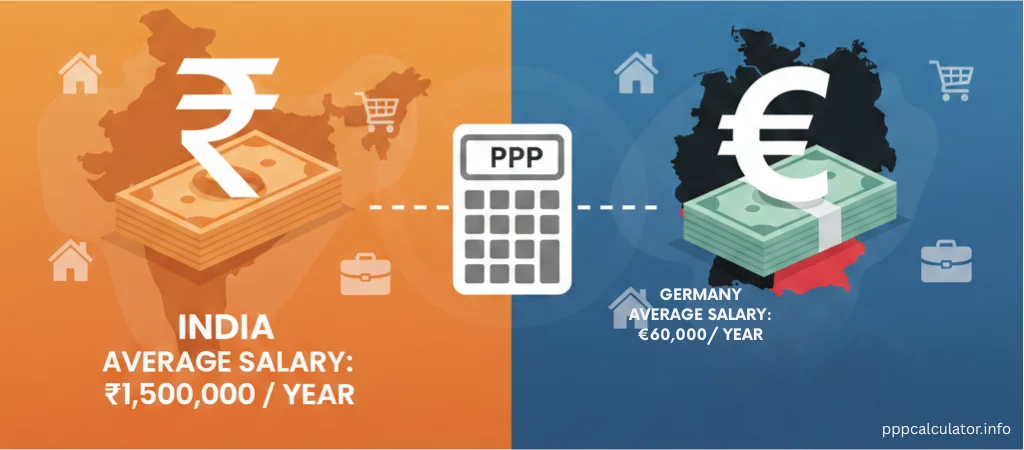
A software engineer in Berlin earns €65,000 a year. Her colleague in Bangalore does the same work for the same company and earns ₹18 lakhs. Who is better off? The exchange rate says the German salary is worth more. But exchange rates only tell you what currency traders think. They say nothing about what each salary actually buys, where it matters most: groceries, rent, healthcare, a night out with friends.
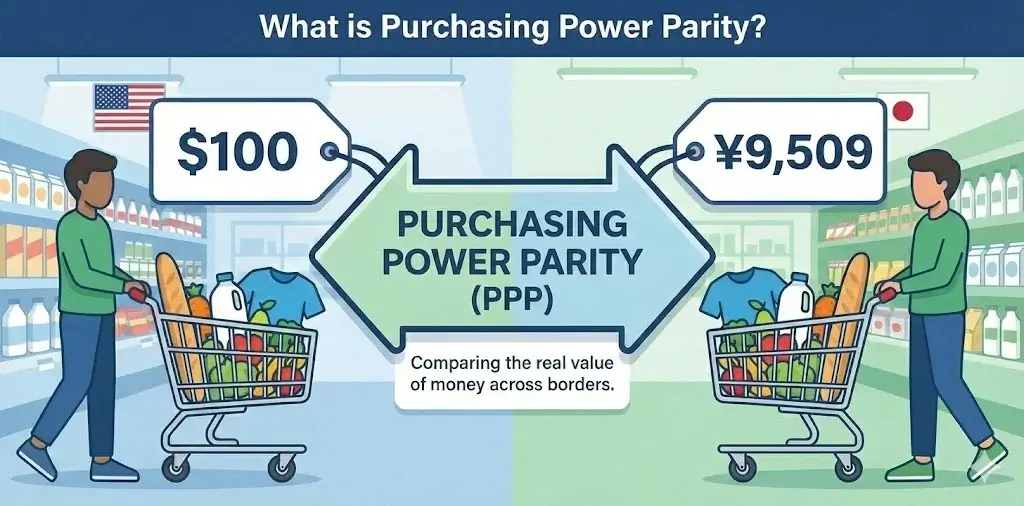
That gap between currency value and real-life buying power is exactly what the purchasing power parity formula closes. Once you understand how it works, you can compare salaries, evaluate job offers, and make relocation decisions with numbers that reflect reality instead of market speculation.
Key Takeaways
- The purchasing power parity formula converts salaries between countries based on what money actually buys, not what currency markets say.
- The World Bank tracks prices of roughly 3,000 goods and services across 176 countries to calculate PPP conversion factors. You only need two numbers and one formula to compare purchasing power between any two countries.
- PPP works well for broad lifestyle comparisons but does not capture city-level differences, tax structures, or individual spending habits. The same salary can mean a comfortable life in one country and a tight budget in another, and the PPP formula reveals that gap.
The Core Purchasing Power Parity Formula
The purchasing power parity formula for salary comparison is simpler than most people expect:
Equivalent Salary = Input Salary x (Target Country PPP Factor / Source Country PPP Factor)
Every country has a PPP conversion factor, published annually by the World Bank. The United States serves as the baseline with a factor of 1.00. Every other country’s factor represents how many units of local currency have the same purchasing power as one US dollar.
India’s PPP factor is 20.20. This does not mean 20.20 rupees equal one dollar on the currency market. It means that 20.20 rupees buy the same basket of goods and services in India that one dollar buys in the United States. The distinction matters enormously, because the market exchange rate for the dollar to rupee is around 83-87, over four times higher than the PPP factor.
Three PPP Examples at Different Income Levels
The best way to understand the purchasing power parity formula is to see it applied across different scenarios.
Example 1: $100,000 USA to India
A US-based product manager earning $100,000 receives an offer from a company in Bangalore. To maintain the same purchasing power, the formula for PPP gives us:
₹20,20,256 = $100,000 x (20.202558 / 1.000000)
That works out to roughly ₹20.2 lakhs. This is not a currency conversion. It means ₹20.2 lakhs in India buys the same quality of life that $100,000 buys in the United States. If the Indian offer is ₹25 lakhs, the candidate would actually gain purchasing power by moving.
Example 2: €50,000 Germany to India
A data analyst earning €50,000 in Munich considers a transfer to the same company’s Hyderabad office. Notice that neither country is the United States, so both PPP factors come into play:
₹13,87,242 = €50,000 x (20.202558 / 0.728102)
Roughly ₹13.87 lakhs would provide equivalent purchasing power. Germany’s PPP factor (0.728) is less than 1.00 because the euro buys more per unit than the dollar in real terms.
Example 3: £50,000 UK to USA
A marketing director in London is offered a role in New York. The calculation works the same way:
$73,372 = £50,000 x (1.000000 / 0.682911)
The UK’s PPP factor of 0.683 reflects that a pound stretches further than a dollar in purchasing power terms. So the equivalent US salary is higher than what a simple exchange rate conversion would suggest. If the New York offer is $70,000, it actually represents a slight decrease in buying power despite looking like more money on paper.
Where the PPP Numbers Come From

The World Bank coordinates a massive global effort called the International Comparison Program (ICP) to produce these PPP conversion factors. Understanding how they collect and process the data gives you a realistic sense of what the numbers can and cannot tell you.
- Every few years, statistical agencies in over 176 participating countries collect prices for a shared basket of goods and services. The basket covers roughly 3,000 consumer products, 200 types of equipment, about 30 government occupations, and around 15 construction project categories. Trained surveyors visit shops, markets, and service providers in both urban and rural areas across each country to record national average prices.
- The challenge is making these comparisons fair. People in Thailand eat rice daily. People in Ethiopia eat teff. Rice is hard to find at normal prices in Ethiopia, and teff barely exists in Thai markets. The ICP handles this by grouping similar items into “basic headings,” which are the smallest category where spending data exists, and computing PPP factors within those groups first.
- From there, the ICP uses a statistical method called GEKS (named after four economists) to aggregate these basic-heading comparisons into country-level PPP factors. The GEKS method ensures that comparisons remain consistent no matter which pair of countries you examine. Without this step, comparing India to Germany might give a different implied relationship than comparing each of them to Japan separately.
The final output is the conversion factor table that our PPP Calculator uses, updated annually with the most recent price data available.
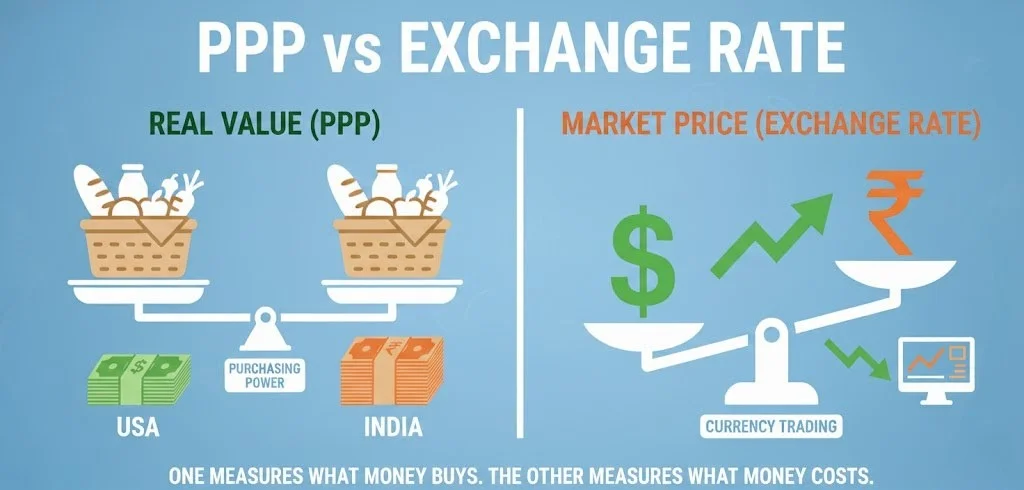
How PPP Differs from Exchange Rates

This distinction trips up even experienced professionals, so it is worth examining carefully. If you need a deeper exploration, our guide on PPP vs Exchange Rate covers this in detail.
Exchange rates reflect what currency traders, central banks, and international investors are willing to pay for one currency in terms of another. They respond to interest rate decisions, trade balances, geopolitical events, and speculation. A currency can swing 10-20% in a year without any meaningful change in what everyday goods cost domestically.
PPP factors, by contrast, are anchored to what things actually cost where people live. A loaf of bread, a month of rent, a doctor’s visit, a bus fare. These prices change slowly and reflect the real cost of living in each country.
Here is what this looks like in practice: The market exchange rate for the US dollar to Indian rupee hovers around 89-90 INR per dollar. But India’s PPP factor is 20.20. That fourfold difference exists because services, housing, food, and transportation are dramatically cheaper in India relative to the United States. A haircut that costs $25 in Chicago might cost ₹200 (about $2.40) in Bangalore, but both haircuts serve the same purpose in daily life.
Economists call this the Balassa-Samuelson effect. In wealthier countries, workers in export-oriented industries (technology, manufacturing, finance) earn high wages. Those wages push up prices for everything else, including services like haircuts, restaurant meals, and rent, because local service workers demand comparable pay. In developing countries, lower wages in service sectors keep these everyday costs low, even though the prices of internationally traded goods (electronics, fuel, imported clothing) stay closer to global levels.
This is precisely why exchange rate conversions mislead salary comparisons. If you convert $100,000 at the market rate, you get roughly ₹85 lakhs, a figure that wildly overstates what you would need to live the same lifestyle in India.
Running the PPP Formula Backward
One common question is whether the Purchasing power parity formula works in reverse. It does, but the result is not simply the reciprocal of the forward calculation. You need to run a fresh calculation.
India to USA:
₹20,00,000 (20 lakhs) salary in India to find the equivalent US salary:
$98,997 = ₹20,00,000 x (1.000000 / 20.202558)
Roughly $99,000 would provide equivalent purchasing power in the United States. Notice that in Example 1, we calculated that $100,000 equals approximately ₹20.2 lakhs. The reverse calculation from ₹20 lakhs gives approximately $99,000, not exactly $100,000. This is because 20 lakhs is slightly less than the 20.2 lakhs equivalent we calculated going the other way. The math is consistent. Always run a fresh calculation rather than flipping a previous result.
PPP Conversion Factor Table
Every PPP calculation depends on the conversion factors from the World Bank data. These factors represent “local currency units per international dollar.” Here is a sample for commonly compared countries:
| Country | Currency | PPP Factor |
|---|---|---|
| United States | USD ($) | 1.000000 |
| India | INR (₹) | 20.202558 |
| United Kingdom | GBP (£) | 0.682911 |
| Germany | EUR (€) | 0.728102 |
| Canada | CAD ($) | 1.137311 |
| Australia | AUD ($) | 1.369197 |
| Japan | JPY (¥) | 95.096275 |
| UAE | AED | 2.366326 |
| Singapore | SGD ($) | 0.803784 |
| Brazil | BRL (R$) | 2.435959 |
A factor below 1.00 means that currency has more purchasing power per unit than the US dollar. A factor above 1.00 means you need more of that currency to match one dollar’s buying power. The full list covering 196 countries is available on the World Bank’s data portal.
To calculate between any two countries, you always divide the target country’s factor by the source country’s factor, then multiply by the salary. You do not need the US dollar as a middleman. The formula of purchasing power parity handles any pair directly, as the Germany to India example demonstrated earlier. For detailed country-pair analysis, see our India vs US salary comparison or the India vs Germany purchasing power guide.
What the PPP Formula Cannot Capture
The Purchasing power parity formula is powerful for broad comparisons, but knowing its limits makes you a smarter user of the data. To understand how PPP compares to other comparison methods, see our guide to what purchasing power parity means in practice.
PPP uses national averages. Living in Mumbai versus a small town in Rajasthan involves very different costs, but India’s PPP factor treats them the same. A $100,000 to ₹20.2 lakhs conversion assumes “average India,” which may not match your actual destination. This limitation is exactly why our guide on PPP at the city level explores supplementary methods for more granular comparisons.
Taxes are excluded. Two salaries with identical purchasing power on paper can feel very different after income tax, social security contributions, and sales taxes. Germany’s effective tax rates for high earners can reach 42%, while the UAE charges no income tax at all. The PPP formula does not adjust for this.
The “basket of goods” reflects average consumption. If your spending is unusual, say, 60% of your income goes to rent in a high-demand city, the PPP comparison may understate your cost of living. Similarly, if you spend heavily on imported luxury goods, you are buying at global prices, not local PPP-adjusted ones.
PPP factors update annually but rely on benchmark surveys conducted every few years. Between benchmarks, the World Bank extrapolates using inflation differentials. In countries experiencing rapid inflation or economic disruption, the published factor may lag behind reality.
Despite these caveats, PPP remains the most reliable tool for comparing what money buys across borders. No single number can capture every nuance, but the purchasing power parity formula gets closer to the truth than exchange rates ever will.
Practical Applications Beyond Salary
While salary comparison is the most common use case, the PPP formula serves several other practical purposes.
Economists and organizations like the IMF use PPP to compare the real size of national economies. China’s GDP measured at market exchange rates is significantly smaller than the US economy. But measured at PPP, China’s economy is comparable in size because domestic goods and services cost far less to produce.
The World Bank’s global poverty line of $2.15 per day is defined in PPP terms for exactly this reason. Without PPP adjustment, a poverty threshold set in dollars would be meaningless in countries where $2 buys several meals.
For remote workers negotiating salaries, PPP provides an objective foundation. Some companies adjust remote pay based on location. A developer in San Francisco earning $150,000 might see a proposed adjustment to $90,000 for moving to Lisbon. The PPP formula helps both sides evaluate whether that adjustment is fair by comparing real purchasing power rather than arbitrary percentage cuts.
HR teams managing global compensation use PPP alongside market salary surveys to set pay bands that feel equitable across offices. The formula answers the fundamental question: how much does an employee in each location need to maintain a comparable standard of living?
Our salary comparison guide covers frameworks for using PPP in these contexts.
Making the Formula Work for You
The purchasing power parity formula distills a complex global pricing exercise into one clean calculation. Two PPP factors, one division, one multiplication, and you have a salary comparison grounded in what money actually buys. That simplicity is its strength, and understanding the methodology behind it helps you use the result wisely.
Start with the purchasing power formula for a baseline comparison. Then layer in the factors it cannot capture: taxes in your specific bracket, housing costs in your target city, and the spending patterns that make your budget different from the national average. The PPP number is your starting point, not your final answer. Try it yourself with our PPP Calculator to see how your salary translates across borders.
Purchasing Power Parity Formula – FAQ
Ans: The World Bank publishes updated PPP factors every year. However, major benchmark surveys through the International Comparison Program happen less frequently, roughly every six years. Between benchmarks, factors are extrapolated using the difference between each country’s inflation rate and US inflation.
Ans: The standard PPP formula is designed for country-level comparisons. It cannot distinguish between cities because the World Bank collects data at the national level. Comparing the cost of living between Mumbai and Delhi, or between New York and Austin, requires city-specific cost indices from sources like regional consumer price surveys. PPP factors treat each country as a single unit.
Ans: Switzerland’s factor (1.00) reflects that Swiss prices are very close to US prices. The Swiss franc buys about as much as the US dollar in real terms. India’s factor of 20.20 means it takes about 20 rupees to buy what one dollar buys in the US. This gap exists because non-traded services, housing, food, and labor are far cheaper in India relative to the United States.
Ans: PPP is more accurate for comparing what a salary actually buys in daily life. Exchange rates reflect financial market activity, which includes speculation, investment flows, and central bank policies that have nothing to do with the cost of groceries or rent. Exchange rates are the right tool when you are physically converting money, for example, sending remittances or paying for imports. But for evaluating whether a job offer in another country supports a similar lifestyle, PPP gives a far more honest picture.
Ans: Partially. The International Comparison Program attempts to price comparable items across countries by specifying detailed product characteristics. A “mid-range men’s cotton shirt” is defined similarly regardless of location. But quality of public services, infrastructure, healthcare standards, and environmental factors vary enormously and are not captured in the basket of goods. Two cities might have similar costs for a doctor’s visit, but the quality of care could differ significantly. PPP measures price equivalence, not experience equivalence.