When you’re planning an international move or evaluating a remote job offer, you need to know what your money will actually buy in a new location. But with dozens of cost of living calculators available online, each using different methods and producing different results, how do you know which one to trust?
The short answer is that not all cost of living calculators are created equal. Some compare prices of specific items like groceries and rent. Others use economic data to show purchasing power differences. And many combine multiple approaches with varying degrees of accuracy.
In this guide, you’ll learn exactly how different cost of living calculation methods work, when to use each one, and why purchasing power parity (PPP) calculators often provide the most reliable results for international comparisons. We’ll compare real examples, show you the strengths and weaknesses of each approach, and help you choose the right tool for your specific needs.
Key Takeaways
- PPP calculators use official World Bank data to show what your salary can actually buy across 180+ countries, making them ideal for international comparisons and remote work negotiations.
- Crowdsourced databases like Numbeo provide detailed item-by-item price comparisons from real users, giving you granular insights into specific expenses like restaurant meals or gym memberships in different cities.
- Index-based calculators from sources like C2ER focus primarily on US cities, using standardized methodology to compare housing, groceries, utilities, and other expenses across American locations.
- Salary-adjusted calculators combine cost of living data with local wage information to show what income you’d need in a new city to maintain your current lifestyle.
- Best approach often involves using multiple methods together to get a complete picture of cost differences, verify numbers across sources, and understand both macro-level purchasing power and specific expense categories.
What is a Cost of Living Calculator?
A cost of living calculator helps you understand how much money you need to maintain your lifestyle in different locations.
These tools matter because the same salary provides vastly different lifestyles depending on where you live.
A software engineer earning $100,000 in San Francisco faces $3,750 monthly rent for a one-bedroom apartment, while that same salary in Austin comes with $1,850 rent for similar housing. Your money simply goes further in some places than others.
Cost of living calculators work by comparing prices across locations. But the methods they use to gather data, calculate comparisons, and present results vary significantly.
The method matters because it determines how accurate and useful the results will be for your specific situation. A calculator that’s perfect for comparing San Diego to Seattle might give misleading results when comparing New York to New Delhi.
1. Purchasing Power Parity (PPP) Calculators
Purchasing power parity calculators use economic data to show what your money can actually buy in different countries. Instead of just converting currencies, PPP compares the real value of your salary based on what goods and services cost in each location.
How PPP Calculators Work
PPP calculators rely on official data from organizations like the World Bank, which tracks prices of hundreds of goods and services across countries. This data forms conversion factors that show relative purchasing power. For example, the World Bank’s 2023 data shows that one US dollar buys what 22.3 Indian rupees buy in India, even though the exchange rate is around 83 rupees per dollar.
The calculation focuses on a standardized “basket of goods” that includes housing, food, transportation, healthcare, and other essentials. By comparing what this basket costs in different countries, PPP reveals true cost differences.
When you use a PPP calculator, you enter your current salary and location, then select your target country. The calculator shows what you’d need to earn in the new location to maintain the same purchasing power.
Real Examples with Verified Numbers
Let’s look at actual calculations from the PPP calculator to see how this works in practice.
Example 1: USA to India
Input: $100,000 USD in USA Output: ₹2,020,000 INR in India
This means to have the same purchasing power as $100,000 in the USA, you would need ₹20.2 lakhs in India. Your money goes much further in India than the exchange rate suggests. At the current exchange rate of about 90 rupees per dollar, $100,000 converts to ₹90 lakhs. But you only need ₹20.2 lakhs to buy the same lifestyle because prices in India are significantly lower.
Example 2: UK to Thailand
Input: £50,000 GBP in UK Output: ฿779,900 THB in Thailand
£50,000 in the UK has equivalent purchasing power to ฿779,900 in Thailand. This dramatic difference explains why Thailand is popular with remote workers and retirees. Your British salary provides much more buying power in Bangkok than in Birmingham.

Strengths of PPP Calculators
- PPP calculators use consistent methodology across all countries as such they excel at international comparisons. The World Bank’s PPP data collection follows the same standards everywhere, making comparisons truly apples-to-apples.
- The data comes from official sources with rigorous quality controls. You’re not relying on crowdsourced information or marketing estimates. This makes PPP calculations reliable for major financial decisions like accepting international job offers or planning relocations.
- PPP also captures the big picture of economic differences. Instead of getting lost in whether bananas cost more in Bangkok or Berlin, you see the overall purchasing power difference. This macro view is perfect for salary negotiations and high-level planning.
- FPPP calculators work across 180+ countries with consistent data. You can compare anywhere to anywhere, from major cities to smaller countries that other calculators don’t cover.
Limitations of PPP Calculators
- PPP calculators show overall purchasing power but don’t break down specific expenses. You won’t learn whether housing or healthcare drives the cost difference. For detailed budgeting, you’ll need to supplement with other tools.
- The data updates annually, not daily. If you’re moving next month, the calculator reflects conditions from the last official data release. Rapid economic changes or currency fluctuations won’t appear immediately.
- PPP also doesn’t account for personal spending patterns. If you eat out constantly, the calculation might not perfectly reflect your situation. The basket of goods represents average consumption, not your specific lifestyle.
- Individual city differences within countries get averaged out. India’s PPP conversion factor applies whether you’re moving to Mumbai or Bangalore, even though these cities have different costs.
2. Crowdsourced Databases (Numbeo)
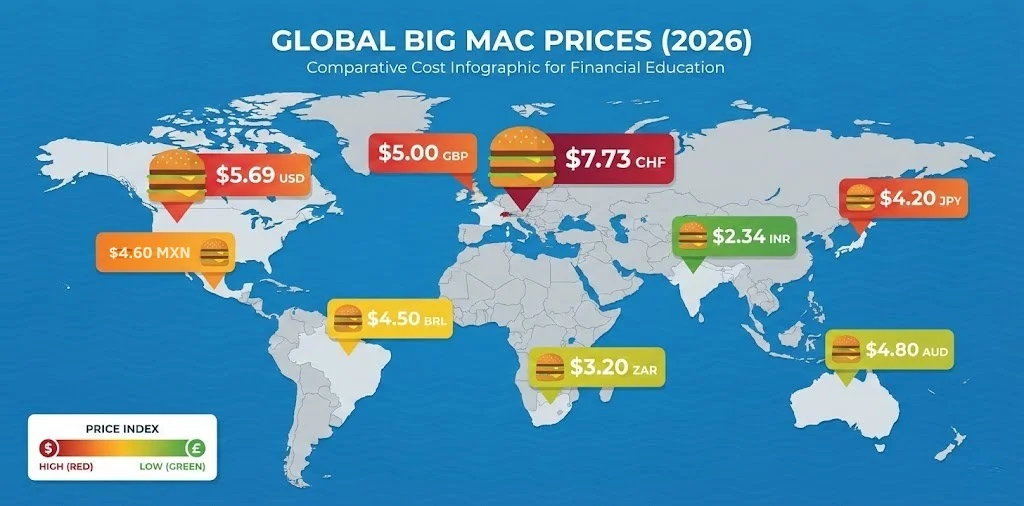
Crowdsourced calculators like Numbeo take a completely different approach. Instead of using official economic data, they collect real prices from actual users around the world. Anyone can contribute the cost of a Big Mac in Bangkok or rent for a one-bedroom in Berlin.
How Numbeo Works
Numbeo operates as a community-driven database with over 870,000 contributors sharing nearly 10 million prices across 12,000+ cities. Users enter specific prices they’ve encountered, from grocery items to taxi fares to apartment rents.
The system calculates various indices by comparing these prices to New York City as a baseline (set at 100). A city with a Cost of Living Index of 80 means prices are about 20% lower than New York. A score of 120 means 20% higher.
Numbeo breaks costs into detailed categories including groceries, restaurants, transportation, utilities, clothing, and rent. You can see exactly what a liter of milk costs in Madrid or monthly gym membership in Manila. This granular detail helps with specific budgeting questions.
The platform combines user submissions with data manually gathered from supermarket websites, government sources, and official statistics. This hybrid approach aims to balance real-world accuracy with systematic collection.
Strengths of Crowdsourced Data
- The detail level is remarkable. You can drill down to specific items like jeans, haircuts, or internet service. This helps answer questions like “How much will I spend on eating out?” or “What’s the typical gym membership?”
- Data updates constantly as users add new prices. You see recent information reflecting current market conditions. If inflation spikes in a particular city, Numbeo’s data should reflect it quickly.
- Crowdsourced approach captures local variations that official statistics might miss. Users know the actual prices at neighborhood stores, not just national averages.
- Numbeo covers lifestyle factors beyond basic costs, including perceived crime rates, healthcare quality, and traffic conditions. This broader view helps assess overall quality of life, not just expenses.
Limitations and Accuracy Concerns
- The biggest concern with crowdsourced data is reliability. Anyone can submit prices, and there’s no verification process. A 2017 incident showed how one person manipulated crime statistics for a Swedish city by repeatedly submitting false data.
- Sample sizes vary dramatically between cities. Popular expat destinations have thousands of data points. Smaller cities might have only a handful of contributors. This creates accuracy problems in less-documented locations.
- User bias affects the data. Expats and tourists might notice and report tourist prices rather than local prices. They might shop at expensive expat-friendly stores instead of budget options locals use.
- Numbeo’s crime and safety data has been specifically criticized by academics as unreliable for cross-country comparisons. The quality varies significantly by category and location.
- The system works best for large, popular cities with many contributors. It’s less reliable for smaller cities and rural areas.
3. Index-Based Calculators (C2ER)
The Council for Community and Economic Research (C2ER) represents the traditional, methodical approach to cost of living comparisons. Founded in 1961, C2ER has published its Cost of Living Index quarterly since 1968.
How C2ER Methodology Works
C2ER employs over 300 independent researchers who collect prices for more than 60 specific goods and services. These researchers visit actual stores, gather real prices, and submit standardized data quarterly.
The methodology is rigid and consistent. Every researcher follows the same protocol, prices the same items, and reports in the same format. This standardization allows reliable comparisons across locations and over time.
C2ER focuses exclusively on US cities and metropolitan areas, with over 300 locations tracked. The data covers six major categories including grocery items, housing, utilities, transportation, healthcare, and miscellaneous goods and services.
The resulting index shows each city’s cost relative to the national average (set at 100). A score of 110 means 10% above average, while 85 means 15% below average.
Strengths of Standardized Data
- The professional data collection ensures quality. You’re not relying on random internet users but trained researchers following strict protocols. This produces consistent, comparable results.
- C2ER data is widely trusted by employers, governments, and researchers. Many companies use it to set salary adjustments for employee relocations. Economic development organizations cite it when promoting their regions.
- The quarterly updates balance freshness with stability. Prices don’t change so fast that you need daily updates, and quarterly collection captures seasonal variations while providing reliable averages.
- Historical data going back decades allows analysis of trends. You can see how a city’s relative cost has changed over time.
Limitations of Index-Based Methods
- C2ER only covers US locations. If you’re comparing San Francisco to Singapore or London to Lima, this tool won’t help. The international scope is zero.
- The data requires paid subscription access for detailed information. While some basic indices are available publicly, comprehensive breakdowns and historical data require payment.
- The basket of goods reflects average American consumption patterns. If your spending is unusual, the index might not accurately represent your personal cost of living.
- The methodology, while rigorous, moves slowly. Quarterly updates mean recent market changes take time to appear. This matters less for stable markets but more during rapid inflation.
4. Salary-Adjusted Calculators
Some calculators combine cost of living data with local salary information to answer the question: “What income do I need in City B to maintain my lifestyle from City A?”
How Salary-Adjusted Calculators Work
These tools start with your current location and income. Then they apply cost of living ratios combined with local salary data to calculate an equivalent income in your target location.
The calculation considers that wages and costs both vary by location. A software engineer might earn $120,000 in San Francisco where rent is $3,750, but the same role pays $85,000 in Austin where rent is $1,850. The calculator helps determine if the Austin offer represents better or worse actual purchasing power.
Many salary-adjusted calculators pull from the Bureau of Labor Statistics for wage data and C2ER or similar sources for cost data. Some proprietary calculators like PayScale’s combine their own salary database with cost indices.
Real-World Example
Consider a marketing manager earning $70,000 in Denver with $1,500 monthly rent. They receive a job offer in Seattle for $85,000.
A salary-adjusted calculator shows Seattle’s overall cost of living is about 30% higher than Denver. Your $70,000 Denver salary would need to be $91,000 in Seattle to maintain the same lifestyle. The $85,000 offer actually represents a decrease in real purchasing power, even though it’s nominally higher.
This type of calculator immediately shows whether a job offer is financially better, the same, or worse than your current situation.
Strengths of Salary Context
- The career relevance is immediate. You’re not just seeing cost differences but understanding how they relate to actual job offers and salary negotiations.
- These calculators often include profession-specific data. You can see what marketing managers typically earn in Seattle, not just general wage levels. This helps evaluate whether an offer is competitive for your field.
- The results guide salary negotiations. If the calculator shows you need $91,000 but the offer is $85,000, you have concrete data to request $6,000 more.
Limitations of Salary-Adjusted Tools
- Accuracy depends entirely on the underlying cost and salary data. If either dataset is outdated or inaccurate, the recommendation will be off.
- These calculators typically focus on US markets. International comparisons are rare because reliable salary data across countries is harder to obtain.
- The tools assume you’ll maintain identical spending patterns. But your lifestyle might change with a move. Maybe you’ll bike instead of driving, or cook more instead of eating out.
- Generic salary data might not reflect your specific situation. Your current role might be underpaid or overpaid relative to market rates. The calculator doesn’t know this context.
Which Method Should You Use?
No single calculator method is perfect for every situation. The right choice depends on what you’re trying to decide and what information you need. Here’s a quick comparison to help you choose the right tool:
| Method | Best For | Coverage | Data Source | Update Frequency | Ideal Users |
|---|---|---|---|---|---|
| PPP Calculators | International salary comparisons, overall purchasing power | 180+ countries worldwide | World Bank official data | Annual | Remote workers, expats, salary negotiators |
| Crowdsourced (Numbeo) | Specific item prices, detailed budgeting | 12,000+ cities globally | User contributions + manual collection | Daily updates | Budget planners, lifestyle comparison seekers |
| Index-Based (C2ER) | US city comparisons, professional relocations | 300+ US cities only | Professional researchers | Quarterly | Domestic relocations, corporate HR teams, US-based job seekers |
| Salary-Adjusted | Job offer evaluation, career planning | Primarily US, some international | Combined salary + cost data | Varies by platform | Job seekers, career changers, salary negotiators |
Using Multiple Methods Together
The smartest approach combines different calculation methods to build a complete picture.
- Start with PPP to understand overall purchasing power differences. This gives you the macro view. If PPP shows you need 40% more salary in City A than City B, that’s your baseline understanding.
- Then use Numbeo or similar tools to drill into specific expense categories. Look at housing costs, food prices, and transportation expenses separately. This helps you understand what drives the overall difference.
- Check salary-adjusted calculators to see how the cost difference relates to typical local wages. Maybe the city is expensive but salaries are proportionally higher, or maybe it’s expensive with average wages.
- Finally, verify key numbers with local sources. Check actual apartment listings in your target city. Look at local government statistics. Join expat forums and ask people living there about real expenses.
This multi-method approach catches discrepancies and gives you confidence in your conclusions. If PPP, Numbeo, and local apartment listings all suggest similar cost levels, you can trust the data. If they wiReal-World Comparison: New York to Lisbon
Tips for Making Better Comparisons
- Start your research early, at least 3-6 months before a planned move. This gives you time to verify data, watch for price changes, and make informed decisions without pressure.
- Document your current spending in detail. Track your actual expenses for 2-3 months across all categories. This personal baseline makes any calculator more accurate because you know your real patterns.
- Join online communities for your target location. Expat forums, local subreddits, and Facebook groups provide ground truth about costs. People living there can tell you if calculator estimates match reality.
- Visit if possible before committing. A week in your target city lets you experience costs firsthand. Stay in a regular neighborhood, shop at local stores, and use public transport to test budget assumptions.
- Build a contingency buffer into your budget. Plan for 10-20% higher costs than calculators suggest. Unexpected expenses always appear, and having buffer prevents financial stress.
- Recheck data closer to your move date. Conditions change. Verify your calculations with current information 1-2 months before relocating to catch any significant changes.
Wrapping Up
Choosing the right cost of living calculator depends on your specific needs and situation. PPP calculators excel at international comparisons using authoritative economic data, making them ideal for remote workers and expats comparing countries. Crowdsourced databases provide granular price details for specific budgeting questions. Index-based tools offer professional methodology for US city comparisons. Salary-adjusted calculators directly answer job offer questions.
The smartest approach uses multiple methods together. Start with PPP for the big picture, drill into specific expenses with detailed databases, and verify everything with local sources. This multi-method strategy catches errors and builds confidence in your financial planning.
Remember that calculators provide estimates, not guarantees. Your actual expenses depend on your lifestyle, habits, and choices. Use calculators as guides for research and planning, but supplement with real-world information from people living in your target location.
Ready to compare your salary’s purchasing power across countries? Try our PPP calculator for reliable international comparisons based on World Bank data.
Cost of Living Calculator – FAQ:
Ans: No single calculator is perfectly accurate because each method has strengths and limitations. PPP calculators using World Bank data are most reliable for international comparisons. C2ER-based tools are best for US city comparisons. Crowdsourced databases like Numbeo provide detailed item prices but with variable accuracy.
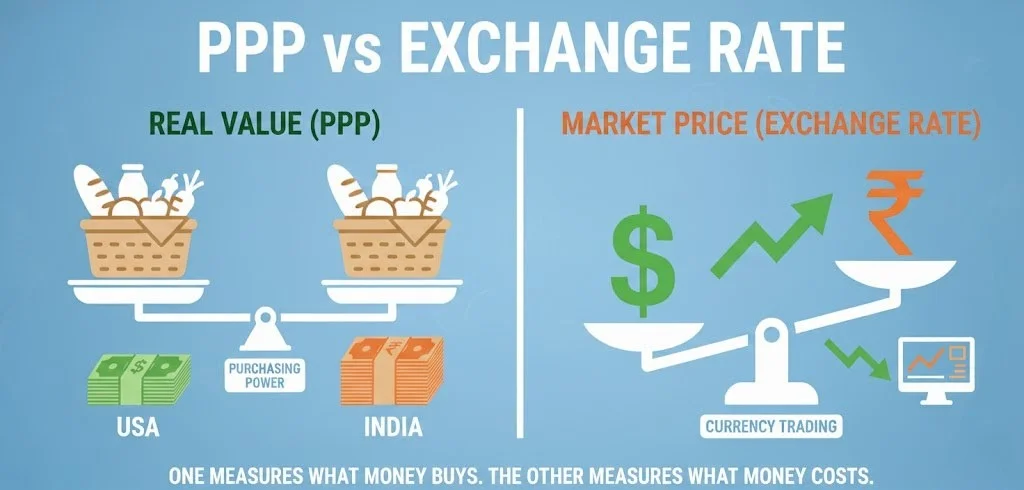
Ans: Exchange rate converters only show how much foreign currency you get for your money. They don’t account for what that currency actually buys. PPP calculators compare purchasing power by looking at what goods and services cost in each location. For example, $100 converts to ₹8,300 at exchange rates, but you might only need ₹2,000 to buy what $100 buys in the US because Indian prices are lower.
Ans: Crowdsourced data like Numbeo provides useful insights but requires careful evaluation. It works best for popular cities with many contributors. For smaller cities with few contributors, accuracy decreases. Always cross-reference crowdsourced data with other sources before making major decisions.
Ans: Most basic cost of living calculators focus on expenses and don’t include tax differences. Some salary-adjusted calculators factor in taxes, but many don’t.