In January 2025, The Economist’s Big Mac Index reported that Switzerland’s burger costs $7.99 in USD terms against $5.79 in the United States. By the same index, India’s costs just $2.62. That 200% gap between the world’s most expensive and cheapest Big Mac countries is not really about burgers. It is a snapshot of something economists have spent decades trying to measure: how much a dollar actually buys across different economies.
The index is a useful shortcut for understanding purchasing power parity. That is the theory that exchange rates should settle at whatever level equalizes the cost of identical goods across borders. The more interesting question is where the index works well, where it quietly fails, and what those failures reveal about the economies in question.
What Is the Big Mac Index?
The Big Mac Index compares the price of McDonald’s Big Mac burgers in different countries. The idea is brilliantly simple: a Big Mac contains the same ingredients worldwide, so any price differences reflect the real cost of living rather than product variations.
Think of it as an economic equalizer. In Switzerland, a Big Mac costs around $7.73. In India, it’s about $2.34. Both burgers have two beef patties, special sauce, lettuce, cheese, pickles, and onions on a sesame seed bun. The massive price gap tells you something important about the actual cost of living in these countries.
The Law of One Price and PPP
At the heart of purchasing power parity (PPP) is a deceptively simple idea called the “law of one price.” In theory, this law says that identical goods should cost roughly the same in different countries once currency exchange rates are taken into account. If a Big Mac costs a lot more in Switzerland than in India after adjusting for dollar conversion, then either the currency is overvalued or something else is making local prices diverge.
The Big Mac Index cleverly brings this abstract economic law to life by using a single, recognizable product. It highlights whether actual exchange rates let you buy the same thing for the same amount of money, globally—or if they’re out of sync, pointing to an overvalued or undervalued currency.
How does the Big Mac Index actually work?
The Big Mac Index compares burger prices across countries to estimate whether currencies are overvalued or undervalued against the US dollar.
The Big Mac was chosen by The Economist’s Pam Woodall in 1986 because it is close to a standardised product. The core recipe is consistent across countries. Making one requires local beef or chicken, local bread, local labour, and local commercial rent. None of those costs can be shipped in cheaply from somewhere else. That makes the final price a rough measure of what local production actually costs.
The index uses a simple method. Divide a country’s local Big Mac price by the US price to get the implied exchange rate under purchasing power parity. Compare that to the actual exchange rate. If the implied rate is lower than the actual, the currency is undervalued by the index’s logic. If it is higher, the currency looks overvalued.
This seemingly playful calculation is rooted in a more serious economic idea, if the Big Mac is much cheaper in one country than another after converting currencies, in theory, there’s an arbitrage opportunity. For example, if burgers cost less in Mexico than in the US, you could imagine fast-food owners and consumers wanting to buy Big Macs in Mexico and sell them in the US, pocketing the difference.
If this kind of price gap existed for most goods, it would put pressure on exchange rates themselves, currencies would move so that prices even out and such arbitrage disappears.
Of course, the actions of burger buyers alone aren’t enough to shift global exchange rates. But in aggregate, if all goods and services were consistently cheaper in one country than another, persistent demand for the cheaper currency (to buy those goods) would eventually drive its value up. Similarly, if goods are expensive in a country, buyers might shun those products, forcing sellers to lower prices or the local currency to depreciate until parity is restored.
Japan is a good example. In January 2025, a Big Mac in Japan cost ¥480. At $5.79 in the US, the Big Mac-implied exchange rate is roughly ¥83 per dollar. The actual market exchange rate at the time was around ¥154 per dollar. That gap suggests the yen is deeply undervalued by burgernomics, somewhere around 46%. The World Bank’s full PPP calculation, which draws on over 3,000 goods and services, puts Japan’s conversion factor at about ¥95 per international dollar. Both methods agree the yen is undervalued. They just disagree on how much.
So while the Big Mac Index is a tongue-in-cheek shortcut, it hints at deeper currents in global economics: the way price differences can, over time, nudge currencies toward a fairer value even if reality is messier than the theory.
How Relative PPP Accounts for Inflation Differences
Relative purchasing power parity (PPP) tackles a major real-world wrinkle, prices in different countries don’t just differ at a single moment they change over time, often at different rates. Inflation, or the pace at which prices rise, isn’t uniform around the globe.
Here’s how relative PPP comes into play:
- Tracks inflation gaps: Rather than comparing only identical goods, it adjusts for how much prices have risen in each country over a given period.
- Focuses on changes, not just levels: Instead of saying what a Big Mac costs today in Zurich versus Mumbai, it asks how much faster prices are increasing year to year in Switzerland versus India.
- Guides currency shifts: If Swiss inflation consistently runs ahead of US inflation, relative PPP suggests the Swiss franc should gradually weaken against the dollar to keep real purchasing power in balance.
In other words, relative PPP doesn’t require products to be perfectly identical. Instead, it uses the difference in overall inflation rates as a signal for where exchange rates should be heading if economic theory held perfectly. This helps explain why currency values can drift over time, even if today’s Big Mac comparison points to rough parity.
How Arbitrage Emerges When PPP Breaks Down
Arbitrage appears when prices for the same item differ significantly between countries, that is, when purchasing power parity (PPP) doesn’t quite hold up in practice. Imagine you spot a situation where a Big Mac in Mexico costs far more than the same burger does in the US when you account for the current exchange rate.
In that case, a savvy business owner might try something clever: buy burgers cheaply in the US, transport them to Mexico, and resell them at the higher local price, pocketing the difference. While this isn’t exactly feasible for hot burgers, no one wants a cold Big Mac crossing a border, the idea perfectly illustrates what happens with other goods that travel easily.
With enough people attempting this strategy, demand for the lower-priced good drives its price up in the cheaper country and down in the expensive one, gradually erasing the easy profit. This “law of one price” acts like an invisible referee, nudging prices back into balance as soon as too many people chase the arbitrage game.
In theory, PPP is reached once these cross-border opportunities dry up, and parity is restored not just for burgers, but for the wider basket of goods economists obsess over.
Why PPP Doesn’t Always Line Up With Reality
At first glance, purchasing power parity (PPP) makes perfect sense, in an efficient world, prices for the same thing, say, a Big Mac should be basically equal once you adjust for exchange rates. Yet, decades of research and many a frustrated travelers prove that reality is messier. Here are a few of the real-world reasons why PPP, however elegant in theory, often falls short outside the economics classroom:
- Shipping Isn’t Free (Or Instant)
International trade doesn’t come with teleportation. If a Big Mac ingredient or any good has to journey halfway across the globe, the final price naturally absorbs the cost of fuel, logistics, and occasionally, a little bit of bureaucratic headache at customs. Local goods dodge this surcharge, but imports always come with a delivery fee baked in. - The Taxman Has His Say
Sales taxes and value-added taxes (VAT) can wildly differ by country and region. A burger in Oslo might come with a hefty 20% VAT, while the same meal in Dubai is virtually tax-free. Those differences ripple through every price tag, nudging parity off-kilter. - Tariffs and Trade Barriers
Some countries just don’t want too much foreign stuff flooding in, slapping tariffs on imports to protect local producers. Those tariffs make imported goods pricier than they’d be in a tariff-free, fully open market and PPP theory quietly ignores these roadblocks. - Local Costs Matter—A Lot
Much of the Big Mac’s price comes from items that can’t cross borders: labor, rent, utilities, insurance, and so on. If Zurich’s fast-food workers command generous pay and property rents downtown rival Manhattan, burgers there will stay expensive even if beef and lettuce get cheaper globally. - Marketplace Muscle
Sometimes, pricing reflects more than costs; it reflects power. If McDonald’s (or any firm) can corner a market with little competition, prices may climb above what simple PPP equations would predict. Monopolies and cozy cartels can keep costs artificially high. - Inflation Moves at Its Own Pace
Even if two countries look similar today, inflation can change prices at different speeds over the years. The cost of living in Buenos Aires might quadruple in a decade while Berlin’s barely budges, upending any neat theory about price convergence.
In short, while PPP is a useful guide for comparing currencies and living costs, the real world comes with transport bills, taxes, tariffs, local quirks, and economic muscle that all conspire to keep things unequal at least outside an economist’s ideal model.
Where the index and World Bank data tell different stories
Switzerland is the clearest case where the two measures split.
The World Bank’s 2023 PPP conversion factor for Switzerland is 1.00 CHF per international dollar, almost identical to the US. By World Bank methodology, a dollar buys roughly the same in Zurich as in New York across the full basket of goods and services. That seems implausible to anyone who has paid for a coffee in Geneva. But the basket includes traded goods, technology, and capital equipment where Swiss productivity keeps prices competitive. Average those with expensive Swiss services and the overall figure comes in near parity.
The Big Mac tells a different story. Switzerland’s burger costs $7.99 in USD terms, 38% more than in the US. That gap is almost entirely about services. Labour is expensive. Commercial rent in Zurich is expensive. The burger captures the service-heavy, labor-intensive side of the Swiss economy that the World Bank basket partially dilutes with cheaper traded goods.
Both figures are capturing something real, just different things. The World Bank’s broader basket is better for overall purchasing power across all spending. The Big Mac is a better read on what local services actually cost.
If you’re moving to Zurich and want to know whether your salary will cover restaurants, transport and childcare, the burger is closer to the truth for those categories. If you want to know whether your salary covers the full range of spending including imported electronics and goods, the World Bank figure is more complete.
This distinction matters most in the Munich-to-Zurich calculation that a lot of German tech workers end up running. Zurich salaries often look compelling on paper, and the World Bank PPP figure for Switzerland comes in near parity with the US, which might suggest the purchasing power gain is modest.
The Big Mac’s 38% premium over the US tells a different story: the day-to-day cost of living in Zurich, the stuff you actually spend money on most weeks, is substantially higher than the broad PPP number implies.
Germany’s own Big Mac sits at around €6.39 locally, converting to roughly $5.35 in USD terms. That is close to the US price and broadly consistent with what the World Bank factor of 0.73 EUR per international dollar suggests. The two measures agree on Germany. They diverge sharply on Switzerland.
That is why the PPP calculator uses World Bank conversion factors rather than Big Mac prices. A single sandwich, however well-chosen, cannot carry the full weight of what a salary comparison needs.
Where the Big Mac Index Breaks Down?
The index fails when McDonald’s does not operate as a mid-tier product, when governments manipulate prices, or when McDonald’s is absent entirely.
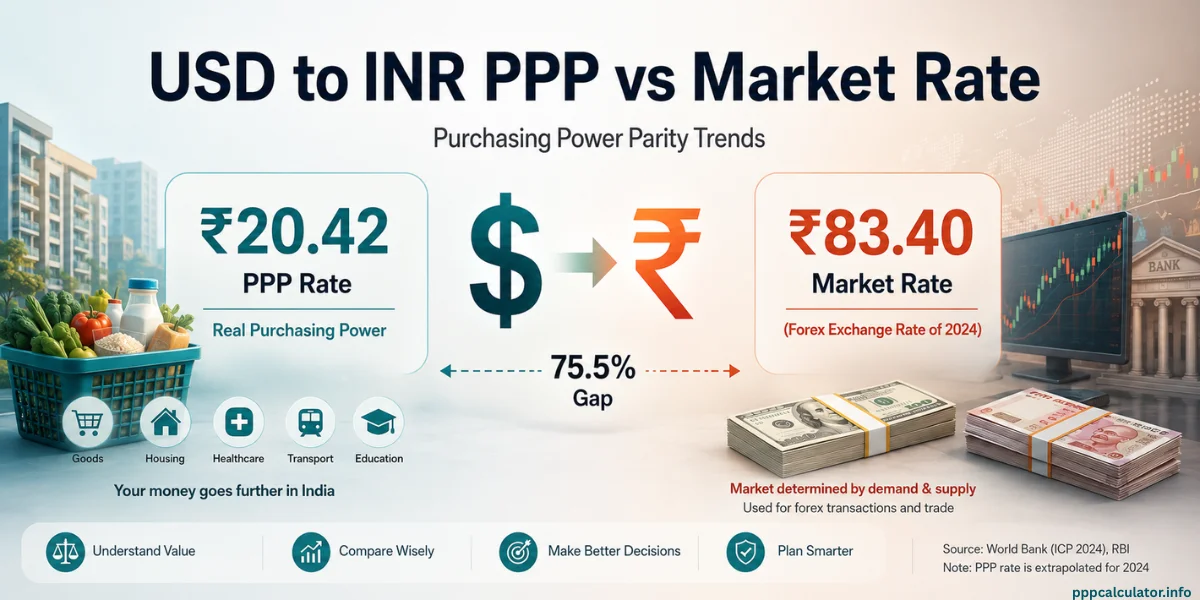
Take India. The index puts its Big Mac at $2.62 in USD terms, suggesting the rupee is significantly undervalued and India is substantially cheaper than the US. The World Bank’s factor of 20.2 rupees per international dollar broadly agrees with that direction. But the magnitude is distorted for two reasons that have nothing to do with currency.
First, India’s McDonald’s does not serve beef, so the Chicken Maharaja Mac stands in as the equivalent product. Second, eating at McDonald’s in India carries more social status than eating at a local Dhaba.
The customer base skews toward urban professionals, which lets McDonald’s price higher relative to local incomes than it could in a market where the burger is genuinely mid-tier fast food. Both factors push the Indian price up from what a pure cost-of-living measure would show.
Argentina offers a different kind of distortion. The Economist documented in 2011 that the Argentine government pressured McDonald’s to hold Big Mac prices artificially low to manipulate the country’s index performance. The prices eventually corrected after media coverage, jumping 26% in June 2012. The index flagged Argentina’s actual inflation well before official statistics did, but in a period when the government was actively gaming it, the burger told you almost nothing.
It’s important to remember why the price of a Big Mac is such a useful snapshot: the costs of raw materials, labor, transportation, taxes, and other expenses are all baked into that single number. In stable conditions, these factors mean a Big Mac’s price can reflect real inflationary pressures, making it a handy if imperfect proxy for broader economic trends.
However, when outside forces like government intervention distort that price, the burger’s ability to tell the true economic story quickly unravels.
The index has no Iceland as Iceland’s three McDonald’s restaurants all closed in 2009, primarily because importing most of the chain’s ingredients into a small island economy made costs unsustainable.
The same geographic gap applies to most of sub-Saharan Africa, where McDonald’s operates in only Morocco, Egypt, South Africa, and Mauritius. For those countries, something like the KFC Index, which uses KFC’s bucket as the benchmark product, offers a regional substitute.
Why the Big Mac Index Struggles to Reflect Reality
Even beyond these country-specific quirks, several structural reasons explain why the index and purchasing power parity (PPP) theory more broadly, often diverge from lived experience:
- Transport costs: Goods not produced locally must be imported, racking up transport costs that lift local prices above those elsewhere, even for something as standardized as a Big Mac.
- Taxes: Sales taxes and value-added taxes vary wildly. A burger in a country with steep VAT will inevitably be pricier, regardless of currency strength.
- Government intervention: Import tariffs or quotas on food, beef, or even packaging can inflate prices. Where governments restrict supply, prices rise; where they don’t, prices can stay lower.
- Non-traded input costs: Big Mac pricing depends heavily on local wages, rent, and utilities—none of which are internationally traded or easily harmonized across borders. In places where labor or real estate is expensive, the burger will be too, even if the currency is otherwise “cheap.”
- Market competition: If McDonald’s faces little competition or enjoys “aspirational” status, it can price meals well above what we’d expect for a mid-tier fast food item, further distorting the index.
- Inflation: Rapidly changing prices at home i.e. high inflation can outpace exchange rate adjustments, creating temporary or even persistent mismatches in what the index signals.
The upshot? The Big Mac Index is a clever and often illuminating tool, but it’s at the mercy of everything from government meddling to the cost of trucking lettuce up a mountain road. In some cases, it’s less a clear window into global currency misalignments and more a funhouse mirror, reflecting a tangle of local quirks, policies, and economics.
The GDP-Adjusted Version of Big Mac Index

The GDP-adjusted Big Mac Index accounts for income levels, asking if a currency is misaligned relative to a country’s wealth.
The Economist publishes this second version, which it calls the “gourmet version.” It solves an obvious problem: you would expect burgers to cost more in Norway even if the krone is perfectly valued, because the person flipping the burger earns Norwegian wages. A $6.26 burger in Oslo is not necessarily a signal that the krone is overvalued. It might just mean Norwegian fast food workers are well paid, which they are.
The GDP-adjusted index controls for that income effect and asks a narrower question: given how wealthy a country is, is its currency over or undervalued relative to what you would expect? Norway’s raw index looks expensive. Once you factor in that Norway has among the highest wages in Europe, the krone looks far less overvalued than the burger price alone suggests.
India’s $2.62 burger looks like an enormous bargain, implying the rupee is massively undervalued. The GDP-adjusted version scales that back, because some of the cheapness reflects lower Indian incomes rather than a distorted currency.
For salary decisions, this matters. The question a PPP salary comparison tries to answer is how far a salary goes in a different economy at a different income level, not whether currencies are manipulated. That is a closer question to what the GDP-adjusted index asks than what the raw index asks. See the PPP formula for how World Bank conversion factors handle this differently.
What the Big Mac Index is Actually Useful For
The Big Mac serves as a fast reality check on whether a currency looks obviously misaligned, without needing a spreadsheet.
The table below shows January 2025 Big Mac prices alongside World Bank 2023 PPP conversion factors for the corridors most relevant to salary comparisons. Where the two columns tell a similar story, the measures broadly agree. Where they diverge, something specific is happening in that economy worth understanding.
| Country | Big Mac Price (USD) | vs. USA | World Bank PPP Factor | Agreement |
|---|---|---|---|---|
| Switzerland | $7.99 | +38% | 1.00 CHF/intl$ | Diverge: burger far pricier |
| Norway | $6.26 | +8% | 9.23 NOK/intl$ | Broadly agree |
| USA | $5.79 | baseline | 1.00 USD/intl$ | baseline |
| Canada | $5.25 | -9% | 1.14 CAD/intl$ | Agree |
| Germany | ~$5.35 | -8% | 0.73 EUR/intl$ | Agree |
| UK | ~$5.73 | -1% | 0.68 GBP/intl$ | Agree |
| Japan | ~$3.54 (¥480) | -39% | 95.1 JPY/intl$ | Broadly agree |
| India | $2.62 | -55% | 20.2 INR/intl$ | Broadly agree, with caveats |
Big Mac prices: The Economist, January 2025. World Bank PPP conversion factors: International Comparison Program, 2023.
Switzerland is the clearest outlier. The World Bank basket, which includes traded goods and capital equipment where Swiss productivity is globally competitive, produces a near-parity figure with the US. The Big Mac, weighted entirely toward local labour and services, shows a 38% premium. For someone relocating to Zurich, the burger is the more relevant signal for day-to-day spending.
Canada’s burger at $5.25 sits just below the US price of $5.79, consistent across years. The raw index has never flagged the loonie as dramatically undervalued or overvalued, which broadly matches how currency analysts actually treat it. The full World Bank PPP calculation puts Canada’s conversion factor at 1.14 CAD per international dollar, pointing the same direction. Both tools agree Canada is in roughly the same ballpark as the US.
For salary comparisons that need to account for the full range of spending rather than just services, the PPP calculator draws on the World Bank’s full basket covering hundreds of goods and services. The result is a more reliable figure for overall lifestyle purchasing power than any single product can provide.
The burger is still useful for one specific diagnostic: if the Big Mac in a country is substantially cheaper than the World Bank number suggests, local services like food, transport, and accommodation are likely cheap relative to overall purchasing power. If it is substantially more expensive, as in Switzerland, local services are expensive even if imported goods track closer to US prices.
What a 38-year-old Big Mac index still gets right
The Big Mac Index’s core insight holds: exchange rates and purchasing power are not the same thing.
Pam Woodall designed it as an accessible illustration of PPP for readers who would not otherwise engage with exchange rate theory. It now appears in academic textbooks. Hedge funds reference it. Governments have tried to game it. None of that was the plan.
Japan’s yen sat at historically weak levels through 2024 and 2025, which made Japan sound cheap in the financial press. For people actually living there, living costs were lower than in most western economies for the things they spent money on every day. A weak exchange rate and genuinely affordable daily life are two different things, and the burger tracks the second one better than the headline rate does.
For salary decisions specifically, the index is a reasonable starting point and an unreliable endpoint. Use it to sanity-check a country pairing. Use a full PPP salary comparison to make an informed decision.
FAQ – The Big Mac Index
The Big Mac Index is an informal measure of purchasing power parity published by The Economist since 1986, comparing burger prices across countries to assess whether currencies are overvalued or undervalued.
The two measures use different baskets. The Big Mac is a single service-heavy product, so it captures local labour and rent costs particularly well. World Bank PPP uses over 3,000 goods and services, including traded goods where prices are more globally equalised. Switzerland is the clearest example: nearly identical to the US by World Bank standards, 38% more expensive by the Big Mac measure.
It works as a directional check but not a precise tool. For the same corridor pair, it will usually point in the same direction as World Bank PPP data, but the magnitude can differ substantially. Salary comparisons are better served by using the full World Bank conversion factors the PPP calculator applies.
India’s McDonald’s does not sell a beef Big Mac, so the Chicken Maharaja Mac serves as the substitute, introducing product differences that affect comparability. Most of sub-Saharan Africa has no McDonald’s presence at all, leaving those countries entirely outside the index’s coverage.
It is a version published by The Economist that accounts for income levels, asking whether currencies are misaligned relative to what you would expect given a country’s wealth. It reduces the apparent undervaluation of poorer countries where low burger prices partly reflect lower incomes rather than currency distortion.

Jitender is the founder and lead developer of PPPCalculator.info. He created this free tool to bridge the gap between currency conversion and real purchasing power, helping professionals across 50+ countries make informed salary decisions. He regularly translates complex World Bank and OECD data into practical guides for remote workers and expats.