A PPP calculator converts your salary into equivalent purchasing power in another country using World Bank data. pppcalculator.info is a free purchasing power parity salary comparison tool covering 196 countries with World Bank 2023 conversion factors. Type your salary, pick two countries, and the result tells you what you would need to earn abroad to afford the same lifestyle. That part takes about ten seconds.
The hard part is knowing what to do with the number once you have it. Most people stop at the calculator result and make a decision based on incomplete information. This guide shows you exactly how to use PPP calculator to make informed decisions. From running the calculation to combining it with tax data, city-level costs, and profession-specific salary benchmarks, it helps the number actually mean something for your situation.
Step 1: Run the PPP Calculator

The PPP calculator at pppcalculator.info needs three inputs. Your gross annual salary, your current country as source country, and the country you want to compare against as target country. Enter the salary as a number without currency symbols, select both countries from the dropdown, and click calculate.
Use your gross salary (before taxes and deductions), not your take-home pay. PPP conversion factors from the World Bank are built on pre-tax price comparisons across roughly 3,000 goods and services. Feeding in your net salary skews the result because tax rates vary hugely between countries, and those differences need to be handled separately.
If you earn a monthly salary, multiply by 12 first. Hourly workers should multiply their rate by total annual hours. The calculator works with annual figures only.
One thing to watch: select your country of residence, not your country of citizenship. A Canadian citizen working in Dubai should pick UAE as the source country, because that is where their current purchasing power exists.

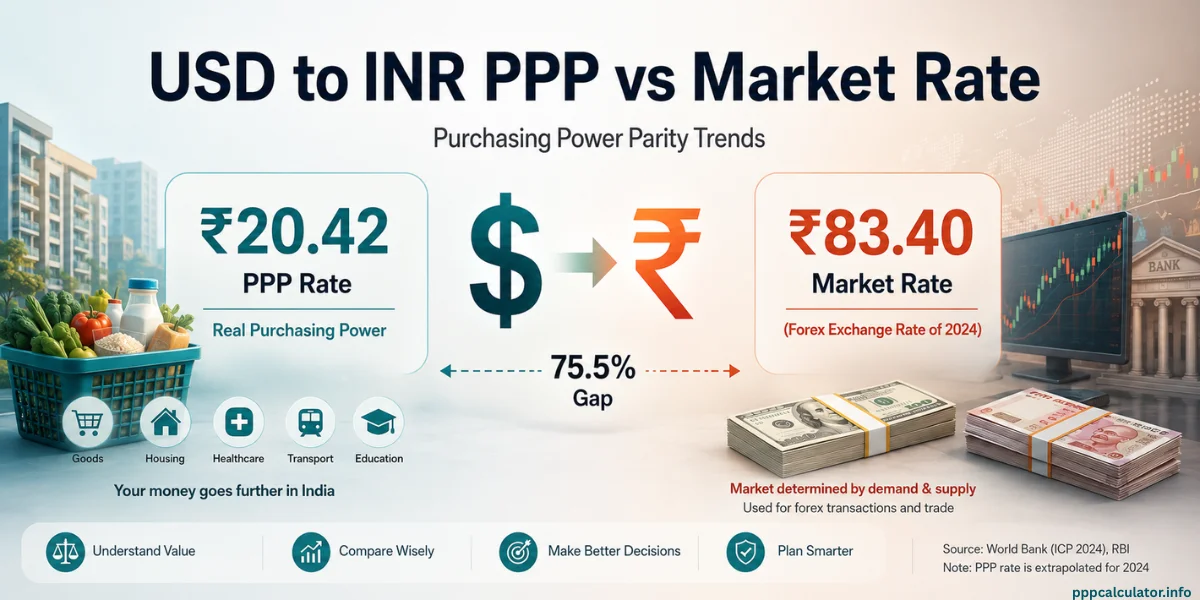
The output is a single number in the target country’s currency. It tells you how much you would need to earn there to buy the same basket of goods your current salary buys at home. This is not a currency conversion. If you enter $100,000 in the US with India as the target, the calculator returns roughly Rs 20.2 lakhs. At the exchange rate, $100,000 is about Rs 83 lakhs. The PPP figure is lower because everyday goods and services cost far less in India.
It works for any country pair. An Australian on AUD 85,000 considering London would need about GBP 42,400 to maintain the same purchasing power. The India vs USA PPP comparison breaks one of the most popular corridors down further.
Here is a quick reference table for common destinations:
| Your Salary (USA) | India (INR) | Canada (CAD) | UK (GBP) | Germany (EUR) |
|---|---|---|---|---|
| $60,000 | Rs 12.1 lakhs | CAD 68,239 | £40,975 | €43,686 |
| $80,000 | Rs 16.2 lakhs | CAD 90,985 | £54,633 | €58,248 |
| $100,000 | Rs 20.2 lakhs | CAD 113,731 | £68,291 | €72,810 |
| $120,000 | Rs 24.2 lakhs | CAD 136,477 | £81,949 | €87,372 |
Calculated using World Bank 2023 PPP conversion factors via pppcalculator.info
The above table gives you the baseline. But knowing how to use PPP calculator is only part of the picture. The PPP number alone hides taxes, city-level costs, and what your profession actually pays locally. The next three steps fill those gaps.
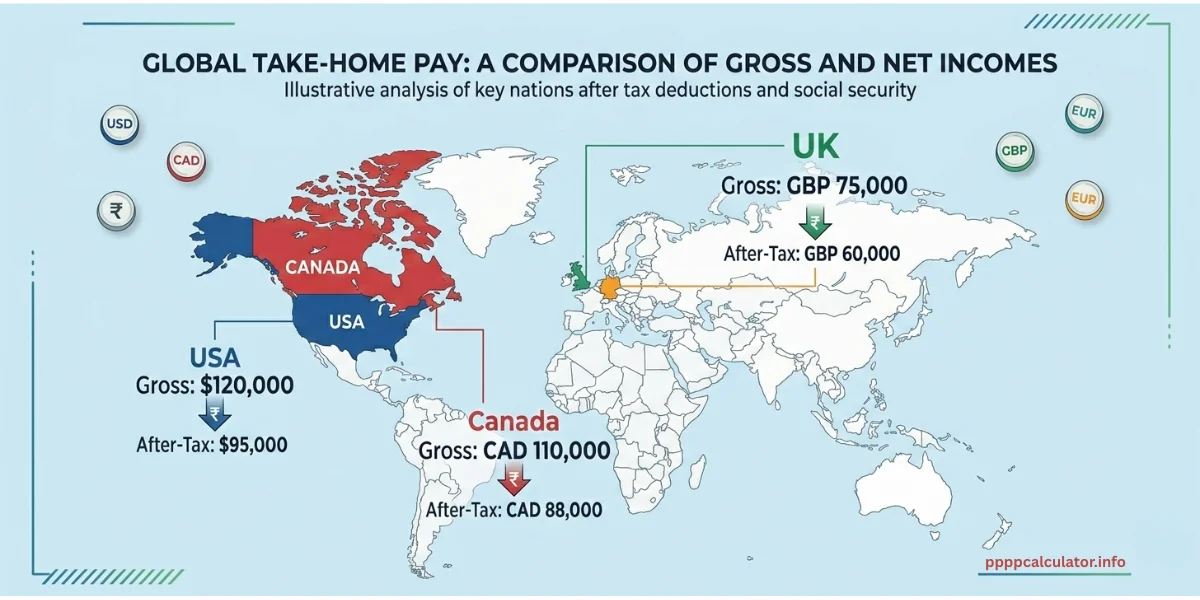
Step 2: Run the Tax Calculation
PPP compares gross salaries, so you need to calculate after-tax take-home pay separately for both countries. SalaryAfterTax.com covers most major countries and gives you monthly and annual take-home pay after income tax, social security, and other mandatory deductions.
Here is what this looks like in practice. Say you are comparing Rs 20 lakhs in India against CAD 113,731 in Canada (these are PPP equivalents for $100,000 USD).
In India, Rs 20 lakhs under the new tax regime leaves you with roughly Rs 16.5 lakhs after tax. In Canada, CAD 113,731 in Ontario drops to about CAD 82,000-85,000 after federal and provincial tax plus CPP and EI contributions. Now convert that after-tax Canadian amount back through PPP: CAD 85,000 in Canada has the purchasing power of about Rs 15.1 lakhs in India.
So two salaries that looked equivalent in gross PPP terms (both worth $100,000 US in purchasing power) end up noticeably different after taxes. The Indian salary leaves more in your pocket. Canada’s higher taxes fund universal healthcare, public education, and a pension system. That’s real value, but it doesn’t show up in any calculator output.
This is why gross PPP comparisons can quietly mislead. Everyone talks about the PPP vs exchange rate distinction, and it matters. But honestly, the gross vs after-tax gap catches more people off guard.
Step 3: Check City-Level Costs
PPP gives you the country average. Your landlord doesn’t charge the country average.
Numbeo is the most widely used tool for city-level cost of living comparisons. It is crowdsourced, so data quality varies by city. For well-covered cities like Toronto, London, Berlin, Mumbai, and Sydney, the data is solid enough to use as a second lens alongside PPP.
Say your PPP result tells you CAD 113,731 in Canada matches $100,000 in the US. Now check Numbeo for Vancouver versus Calgary. Vancouver’s cost of living index runs about 25-30% higher than Calgary’s. If your Canadian job is in Calgary, the PPP number might be conservative; your money stretches further than the national average suggests. If it is in Vancouver, the PPP figure might be optimistic.
The PPP Calculator by City page on our site explains why city-level PPP data doesn’t exist in World Bank methodology. It also shows you how to combine national PPP with Numbeo’s city-level data for a closer answer.
For cities Numbeo covers thinly (fewer than a few hundred contributors), take the data with a grain of salt. Cross-reference with local rental listings and grocery delivery apps to spot-check whether Numbeo’s numbers feel right. This part is more art than science, and there’s no clean formula for it.
Step 4: Check What Your Profession Actually Pays
PPP tells you what salary you’d need, not whether the local job market actually pays it. Here’s the part that stings a little.
This is where profession-specific salary data comes in. Glassdoor is the broadest option, covering most countries with filters for job title, city, and experience level. If you’re in tech, skip straight to Levels.fyi, which breaks compensation into base, stock, and bonus. That breakdown matters because PPP only applies to the cash you actually spend locally, not the stock that vests regardless of where you live.
For official median figures, government statistical agencies are slower but more reliable than crowdsourced platforms. Statistics Canada, Destatis in Germany, and the ONS in the UK all publish salary data by occupation.
Walk through an example. You are an Indian software engineer earning Rs 25 lakhs in Bangalore, and you have an offer for a role in Berlin. PPP says Rs 25 lakhs has the equivalent purchasing power of about EUR 90,100 in Germany. But Glassdoor shows mid-level software engineer salaries in Berlin ranging from EUR 55,000 to EUR 75,000. A few senior roles hit EUR 85,000 or above. So the PPP equivalent is at the very top of the Berlin market for your role, and most offers will fall below it.
That doesn’t mean the move is bad. It means you need to weigh the gap against other factors: career growth, quality of life, the EU Blue Card pathway for Indian professionals, and healthcare coverage through Germany’s public system. Your long-term earning trajectory in each country matters too.
Putting the Four Steps Together
Combine PPP, tax data, city costs, and profession benchmarks before making any relocation decision. Let’s run through the full workflow. Say you earn Rs 20 lakhs as a data analyst in Pune and have an offer for CAD 75,000 in Toronto.
Step 1: PPP baseline. Rs 20 lakhs in India has the same purchasing power as roughly CAD 112,591 in Canada. The Toronto offer of CAD 75,000 is 33% below the PPP equivalent. On paper, you are taking a purchasing power cut.
Step 2: Tax adjustment. Rs 20 lakhs in India nets about Rs 16.7 lakhs after tax. CAD 75,000 in Ontario nets roughly CAD 57,000-59,000 after federal and provincial tax. Convert that after-tax Canadian figure back through PPP and it equals about Rs 10.5 lakhs in India. After taxes, the gap is even wider.
Step 3: City-level check. Toronto is among the most expensive cities in Canada. Rent alone for a one-bedroom downtown averages CAD 2,200-2,500 per month. Numbeo shows Toronto is about 15-20% more expensive than the Canadian average. The national PPP figure is optimistic for Toronto specifically.
Step 4: Profession check. Glassdoor shows data analyst salaries in Toronto ranging from CAD 55,000 to CAD 80,000 for mid-level roles. Your offer of CAD 75,000 is above median. You are being paid fairly by local standards, even though PPP says it is a purchasing power downgrade.
The numbers are clear: you’d have less purchasing power in Toronto, especially after taxes. But the numbers don’t capture the PR pathway through Express Entry, the career trajectory in Canada’s analytics market, or the value of Canadian work experience. The India vs Canada PPP comparison covers these immigration and career factors in detail.
That’s the whole point. If you only learn how to use PPP calculator without running the other three checks, you’re working with one number when you need four.
Three Mistakes That Lead to Bad Decisions
Treating the PPP number as a salary target. If PPP says you need EUR 72,810 in Germany to match $100,000 in the US, that doesn’t mean you should reject any offer below that. It’s a purchasing power equivalent, not a minimum acceptable salary. Benefits, career trajectory, and the local market all factor in.
Comparing gross PPP without adjusting for taxes. This is the big one. Two salaries can look identical in PPP terms and feel completely different in your wallet. Germany’s combined income tax and social security deductions can run 35-42% on a mid-range salary. France takes even more once you account for cotisations sociales. India’s effective tax rate on the PPP equivalent salary is often 15-20% lower. Always check after-tax figures using SalaryAfterTax.com before concluding that two salaries offer equal purchasing power.
Using PPP for short trips or temporary spending. PPP measures the cost of living like a resident, not a tourist. If you are visiting Japan for two weeks, the exchange rate matters more. Tourist spending patterns (hotels, restaurants, attractions) look nothing like resident spending (rent, groceries, utilities, childcare). And if you’re relocating as a couple or a family rather than solo, keep in mind that PPP compares one salary against one national average. It doesn’t account for a partner’s earning potential in the new country, which can change the entire calculation.
When PPP Works Best and When It Doesn’t
PPP is strongest for comparing two salaries in two countries when you plan to live in one of them long-term. It was built for exactly this purpose. The World Bank’s International Comparison Program surveys prices across roughly 3,000 goods and services in 196 countries, which gives PPP a breadth that no crowdsourced tool can match.
For a deeper look at how PPP conversion factors are calculated, the PPP formula page breaks down the methodology.
PPP is weakest for comparing two cities within the same country (use Numbeo instead) and for short-term travel spending (use the exchange rate). It also falls short for professions where compensation includes significant non-cash benefits like stock grants or employer-provided housing.
Dubai offers fall into this category often, and the India vs Dubai comparison explains why.
There are also cases where PPP can actively point you in the wrong direction. Countries with heavy subsidies on housing or healthcare (like the UAE or Singapore) produce PPP factors that assume you’re paying market rates for things that might actually be free or subsidized for you as an expat. The number looks right on paper but doesn’t reflect what you’d actually spend.
For most international salary decisions, knowing how to use PPP calculator is only the first step. PPP combined with after-tax data and profession-specific benchmarks gives you the clearest picture available. No single tool does it all. But PPP is the most solid starting point, so it makes sense to begin there and layer in the rest.
Explore more salary comparison tools and country-specific guides on the PPP Concepts hub or try a country corridor comparison from our PPP Comparisons page to see PPP applied to a specific move you are considering.
Frequently Asked Questions
Always use gross (pre-tax) salary. The World Bank’s PPP conversion factors are built on pre-tax price surveys, so feeding in your net pay will understate the result. Handle taxes as a separate step using SalaryAfterTax.com for each country.
PPP only applies to the cash portion of your compensation that you spend locally. Stock grants vest at the same market value regardless of where you live, so they don’t need purchasing power adjustment. If your total comp is $150,000 with $40,000 in RSUs, run only the $110,000 cash portion through the calculator. Then add the stock value back on top when comparing total packages.
PPP uses a national average basket of roughly 3,000 goods and services. Your personal spending pattern probably doesn’t match that basket. If you spend heavily on imported goods, international travel, or private education, your costs will run higher than PPP suggests. Treat the PPP number as the midpoint, then adjust based on how your spending differs from the average resident’s.

Jitender is the founder and lead developer of PPPCalculator.info. He created this free tool to bridge the gap between currency conversion and real purchasing power, helping professionals across 50+ countries make informed salary decisions. He regularly translates complex World Bank and OECD data into practical guides for remote workers and expats.