Dataset at a Glance
What is the PPP factor
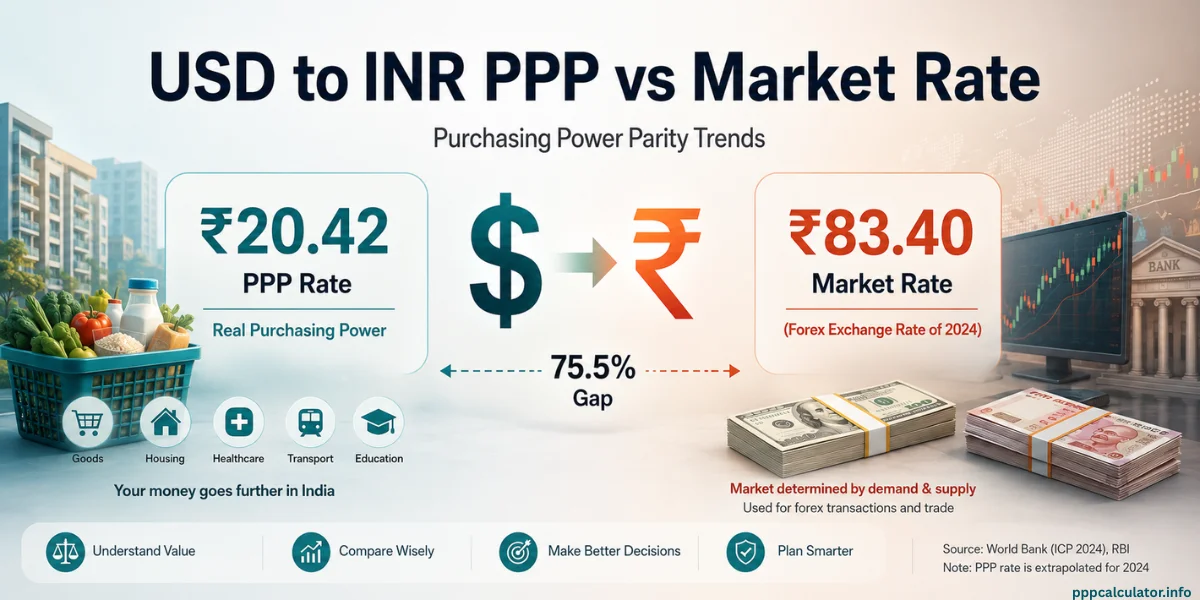
The PPP factor tells you how many units of a country’s money you need to buy what one US dollar buys in America. India’s 2024 figure is 20.42, which means a basket of goods that costs $1 in the US costs about ₹20.42 in India.
That number is not the exchange rate. The exchange rate today is around ₹95per dollar. The PPP factor is around ₹20. The gap between them, almost ₹75, is exactly why your dollars stretch much further in India than the conversion rate suggests. (If you’re new to all this, the guide to purchasing power parity walks through the basics.)
Now, here’s the interesting part. The PPP factor isn’t fixed. It moves over time as prices in different countries grow at different speeds. And in the last decade, it has moved very differently for different places.
Currencies that grew stronger
When a country’s PPP factor goes down, it means the local money is buying more than it used to relative to the dollar. Between 2017 and 2021 (the last two years the World Bank actually surveyed prices), only a few currencies moved meaningfully in this direction.
| Country | 2017 PPP factor | 2021 PPP factor | Change |
|---|---|---|---|
| Switzerland | 1.188 | 1.057 | −11.0% |
| Italy | 0.690 | 0.625 | −9.4% |
| France | 0.770 | 0.704 | −8.6% |
| Singapore | 0.883 | 0.811 | −8.2% |
| Norway | 9.750 | 8.985 | −7.8% |
| Spain | 0.631 | 0.588 | −6.7% |
| Japan | 105.102 | 99.211 | −5.6% |
| Australia | 1.478 | 1.396 | −5.5% |
| Sweden | 8.852 | 8.364 | −5.5% |
| Netherlands | 0.782 | 0.742 | −5.2% |
Switzerland is the standout. The Swiss franc has been quietly getting stronger for over a decade. Its PPP factor dropped from 1.466 in 2010 all the way to 0.973 in 2024, a fall of roughly a third. That happens for a simple reason: Switzerland keeps inflation low and the franc is treated as a safe place to park money during global uncertainty.
Most of the other names on this list are wealthy economies in Europe, plus Japan and Singapore. The pattern is the same across all of them. Stable prices at home, currencies that hold their value, and steady gains against the dollar over time.
Currencies that lost ground
The other end of the table tells a much harsher story. When a country’s PPP factor goes up, it means local prices have run far ahead of US prices, and the local money buys less than it used to. The biggest movers here are countries you’ve probably read about in the news for the wrong reasons.
| Country | 2017 PPP factor | 2021 PPP factor | Change |
|---|---|---|---|
| Sudan | 4.773 | 85.723 | +1,696% |
| Lebanon | 619.013 | 4,099.508 | +562% |
| Iran | 13,061.295 | 50,488.172 | +287% |
| Argentina | 10.293 | 38.783 | +277% |
| South Sudan | 37.191 | 126.743 | +241% |
| Syria | 132.996 | 417.322 | +214% |
| Libya | 0.771 | 1.763 | +129% |
| Suriname | 2.578 | 5.368 | +108% |
| Turkey | 1.384 | 2.752 | +99% |
| Angola | 95.837 | 174.091 | +82% |
These aren’t just numbers. Sudan and Lebanon went through full currency collapses. Lebanon’s banking crisis began in 2019 and never really ended. Sudan has been dealing with conflict, sanctions, and breakaway regions. Iran, Argentina, and Turkey are familiar names on global inflation watchlists.
Argentina’s situation is the most striking. Its PPP factor was 38.8 in 2021. By 2024 it had jumped to 419.9. That’s not a typo. The peso lost roughly nine-tenths of its real spending power against the dollar in just three years. Turkey’s story is similar, with its PPP factor more than quadrupling in the same window.

The quietly stable middle
The headlines belong to the gainers and losers, but most countries don’t make headlines. They sit in the middle, with PPP factors that barely move from year to year. This is where the data is actually most useful, because stable PPP factors mean reliable salary comparisons.
| Country | 2017 PPP factor | 2021 PPP factor | Change |
|---|---|---|---|
| Bahrain | 0.186 | 0.186 | 0.0% |
| Vanuatu | 108.298 | 108.453 | +0.1% |
| Estonia | 0.535 | 0.534 | −0.2% |
| Morocco | 3.937 | 3.946 | +0.2% |
| Nicaragua | 10.536 | 10.564 | +0.3% |
| Maldives | 8.181 | 8.211 | +0.4% |
| Mauritius | 16.545 | 16.629 | +0.5% |
| Poland | 1.743 | 1.753 | +0.6% |
| Peru | 1.744 | 1.734 | −0.6% |
| India | 20.456 | 20.728 | +1.3% |
India sitting in the stable group is worth a moment of attention. Indian inflation in this period averaged 5-6 % a year, which is more than US inflation. So why didn’t India’s PPP factor rise faster?
The answer is that PPP isn’t measuring just one thing. It’s measuring a wide basket: groceries, services, rent, transport, electronics, healthcare, and dozens more categories. Some of those things got more expensive in India faster than in America. Others got more expensive in America faster than in India. When you add it all up, the relative gap stayed roughly the same. That’s why India remains one of the more reliable countries in this dataset for long-term salary comparisons. See our India vs USA salary comparison for what this means in practice.
Big economies on one screen
Here are the world’s 30 largest and most-discussed economies side by side. The “Change 2017→2021” column is the most reliable measure (both years come from real surveys). The “Change 2010→2024” column shows the longer trend and the 2010 and 2024 data is extrapolated.
| Country | 2010 | 2017 benchmark | 2021 benchmark | 2024 extrapolated | Change 2017→2021 | Change 2010→2024 |
|---|---|---|---|---|---|---|
| India | 14.596 | 20.456 | 20.728 | 20.422 | +1.3% | +39.9% |
| China | 3.330 | 4.040 | 3.987 | 3.533 | -1.3% | +6.1% |
| Japan | 111.708 | 105.102 | 99.211 | 94.463 | -5.6% | -15.4% |
| United Kingdom | 0.702 | 0.685 | 0.669 | 0.664 | -2.3% | -5.5% |
| Germany | 0.805 | 0.745 | 0.707 | 0.701 | -5.1% | -13.0% |
| France | 0.855 | 0.770 | 0.704 | 0.681 | -8.6% | -20.3% |
| Brazil | 1.388 | 2.210 | 2.379 | 2.487 | +7.7% | +79.2% |
| Russia | 15.821 | 24.124 | 23.685 | 29.063 | -1.8% | +83.7% |
| Canada | 1.222 | 1.212 | 1.163 | 1.150 | -4.0% | -5.8% |
| Australia | 1.503 | 1.478 | 1.396 | 1.367 | -5.5% | -9.1% |
| Mexico | 7.727 | 8.914 | 10.061 | 9.917 | +12.9% | +28.3% |
| South Korea | 840.494 | 872.625 | 829.868 | 809.267 | -4.9% | -3.7% |
| Turkey | 0.920 | 1.384 | 2.752 | 11.555 | +98.8% | +1155.3% |
| Argentina | 2.255 | 10.293 | 38.783 | 419.901 | +276.8% | +18520.9% |
| South Africa | 4.619 | 6.413 | 7.376 | 7.432 | +15.0% | +60.9% |
| Saudi Arabia | 1.404 | 1.689 | 1.909 | 1.845 | +13.0% | +31.4% |
| United Arab Emirates | 1.933 | 2.285 | 2.363 | 2.330 | +3.4% | +20.6% |
| Singapore | 0.854 | 0.883 | 0.811 | 0.804 | -8.2% | -5.9% |
| Switzerland | 1.466 | 1.188 | 1.057 | 0.973 | -11.0% | -33.7% |
| Netherlands | 0.854 | 0.782 | 0.742 | 0.731 | -5.2% | -14.4% |
| Sweden | 9.027 | 8.852 | 8.364 | 8.490 | -5.5% | -5.9% |
| Norway | 9.154 | 9.750 | 8.985 | 9.142 | -7.8% | -0.1% |
| Thailand | 12.187 | 12.386 | 11.148 | 10.492 | -10.0% | -13.9% |
| Vietnam | 5,813 | 7,212 | 7,120 | 6,957 | -1.3% | +19.7% |
| Indonesia | 3,336 | 4,756 | 4,808 | 4,748 | +1.1% | +42.3% |
| Philippines | 17.774 | 19.699 | 19.375 | 19.357 | -1.6% | +8.9% |
| Pakistan | 21.885 | 33.246 | 43.441 | 66.959 | +30.7% | +206.0% |
| Bangladesh | 22.152 | 29.351 | 28.297 | 29.879 | -3.6% | +34.9% |
| Egypt | 1.531 | 3.169 | 3.855 | 6.248 | +21.6% | +308.2% |
| Nigeria | 73.240 | 114.824 | 146.718 | 176.331 | +27.8% | +140.8% |
| Poland | 1.805 | 1.743 | 1.753 | 1.949 | +0.6% | +8.0% |
| Italy | 0.773 | 0.690 | 0.625 | 0.600 | -9.4% | -22.5% |
| Spain | 0.727 | 0.631 | 0.588 | 0.562 | -6.7% | -22.7% |
| Chile | 359.837 | 397.689 | 423.014 | 435.779 | +6.4% | +21.1% |
| Colombia | 1,121 | 1,328 | 1,340 | 1,444 | +0.9% | +28.8% |
| Peru | 1.475 | 1.744 | 1.734 | 1.782 | -0.6% | +20.8% |
| Malaysia | 1.420 | 1.606 | 1.515 | 1.401 | -5.7% | -1.3% |
| Sri Lanka | 38.565 | 49.274 | 55.527 | 87.269 | +12.7% | +126.3% |
| Kenya | 32.823 | 41.279 | 42.332 | 43.271 | +2.5% | +31.8% |
| New Zealand | 1.497 | 1.431 | 1.464 | 1.464 | +2.3% | -2.2% |

Why some PPP numbers are more reliable than others
Here’s a thing most calculator websites won’t tell you, and it’s important. The World Bank publishes PPP numbers for every year, but not every number comes from the same kind of work.
Every six years or so, the World Bank runs something called the International Comparison Program. Researchers go out and physically check the prices of about 3,000 different things in each participating country. Those years are called benchmark years. The most recent ones were 2017 and 2021. The next one is happening now, with results expected in 2027.
Every year in between, including 2010 and 2024, isn’t surveyed. The World Bank instead takes the last benchmark and adjusts it using each country’s inflation data. That’s a reasonable thing to do. But it’s a calculation, not a measurement.

PPP Trends of All countries
If you want to look up a specific country, the table below has everyone. Use the scroll bar inside the box. Green means the currency gained more than 5%; red means it lost more than 5%; grey means it barely moved.
How to use this data
Three practical situations:
You’re comparing salaries between two countries. Use the most recent year’s PPP factor (usually 2024). For most countries, that’s a good answer. For high-inflation countries like Argentina or Turkey, you may want to use the 2021 benchmark and treat the result as a rough guide. The PPP calculator handles this for you using the same World Bank numbers.
You’re doing research or quoting numbers in a paper. Use the 2021 benchmark and cite the World Bank ICP 2021 cycle, which was released in May 2024. Don’t quote the extrapolated 2024 numbers as if they were measured. They’re calculated.
You want to compare year-over-year changes. Stick to benchmark-to-benchmark comparisons (2017 to 2021). Anything else mixes measured numbers with estimated numbers, and the change you measure will be partly real and partly an artifact of inflation calculations.
Sources and methodology
- Primary source. World Bank, indicator
PA.NUS.PPP, “PPP conversion factor, GDP (LCU per international $)”. Available at data.worldbank.org/indicator/PA.NUS.PPP. - Underlying program. World Bank International Comparison Program (ICP) 2021 cycle, results released May 2024. Methodology details at worldbank.org/en/programs/icp.
- Data file. Bulk download dated 8 April 2026, covering 201 countries with both 2017 and 2021 benchmark readings, of which 196 also have 2024 extrapolated values.
- License. World Bank PPP data is published under the Creative Commons Attribution 4.0 International License (CC BY 4.0).
- How we calculated changes. Change percentages are calculated as (later value − earlier value) ÷ earlier value × 100. A negative change means the local currency strengthened in real spending power. A positive change means it weakened.
- Limitations. Inter-benchmark years (every year except 2017 and 2021 in this dataset) are extrapolated by the World Bank using each country’s GDP deflator. Extrapolation drift can be large for high-inflation countries. We disclose this rather than smooth over it.
PPP Trends – FAQ
The World Bank runs a full benchmark survey every six years. The 2017 cycle was published in 2020. The 2021 cycle was published in May 2024. The 2024 cycle is in progress now and is expected to publish around 2027. Between benchmarks, the World Bank releases extrapolated values once a year using inflation data.
The exchange rate is set by currency markets. It moves with trading, central bank policy, and capital flows. The PPP factor is set by relative price levels and reflects what your money actually buys in goods and services. The two numbers diverge because services, rent, and local food are systematically cheaper in lower-income countries.
For most countries, yes. The extrapolation tracks reality closely when inflation is stable and the economy isn’t in crisis. For countries with runaway inflation or currency collapses, the extrapolated number can drift significantly from what a real survey would find. The methodology section above lists the high-risk countries.
The ICP 2024 cycle is currently in progress. Final results are expected to publish around 2027. That release will reset PPP factors for all participating countries based on actual 2024 price surveys. Until then, every value after 2021 in this dataset is an extrapolation.
Where can I download the raw World Bank data?
The full dataset is freely available from the World Bank at data.worldbank.org/indicator/PA.NUS.PPP in CSV, XML, and Excel formats. Use the indicator code PA.NUS.PPP if you’re querying the API directly.

Jitender is the founder and lead developer of PPPCalculator.info. He created this free tool to bridge the gap between currency conversion and real purchasing power, helping professionals across 50+ countries make informed salary decisions. He regularly translates complex World Bank and OECD data into practical guides for remote workers and expats.