You’ve just made your fifth international hire. One is in Berlin, one in Bangalore, one in Buenos Aires. They’re doing comparable work. But their salaries were set in three different conversations, with three different hiring managers, using three different reference points.
That’s not a pay strategy. That’s a lawsuit waiting to happen or at minimum, a retention problem.
Geographic pay bands solve this. By the end of this article, you’ll have a clear framework for building your first system: which methodology to choose, what data inputs to use, how to run the calculation, and how to communicate the result to your team without triggering a conversation you aren’t ready for.
What Are Geographic Pay Bands?

Geographic pay bands are salary ranges tied to where an employee works rather than a single global rate. Instead of one band for “Senior Engineer,” you have bands by location: one for Germany, one for Poland, one for India, each calibrated to reflect what fair and competitive pay looks like in that market.
The alternative, a flat global salary regardless of location, sounds equitable but creates two distinct problems at scale. Pay at San Francisco rates globally and your Warsaw hire earns ten times what senior Warsaw engineers make locally, which distorts the local market and creates resentment among local hires.
Pay at a lower global rate and your Toronto or Amsterdam hires can’t cover rent and accept the first better offer they receive.
The other thing worth stating clearly, geographic pay bands are not a mechanism for paying people less. They’re a structure for paying people fairly relative to where their money actually goes. That distinction matters because it’s the first question your employees will ask when you introduce a banded system.
The 3 Models Remote Companies Actually Use
1. Location-Tiered (GitLab Model)
GitLab’s geographic pay bands system groups countries into location tiers and assigns each tier a factor that adjusts salary relative to a San Francisco benchmark.
The company publishes its full methodology in its public handbook, including the formula components: SF Benchmark x Location Factor x Level Factor x Experience Factor x Contract Type Factor.
The location factor is derived from third-party compensation survey data (not cost of living) and reflects what competing employers pay in each market. GitLab is explicit on this point, they pay based on cost of labor, not cost of living. An engineer in Amsterdam draws a different location factor than one in Warsaw because the talent markets are materially different, not because Amsterdam is more expensive.
Pros: simple to administer, defensible to candidates because the methodology is public, reduces negotiation friction when candidates understand upfront how the number was built.
Cons: tier boundaries create cliff edges. A candidate 50 miles from a geographic pay band boundary can end up in a significantly lower band than a comparable hire.
Managing tier assignment as employees relocate requires clear written policy before the first move happens.
2. Cost-of-Living Indexed (Buffer Model)
Buffer benchmarks all salaries to San Francisco 50th percentile data (currently sourced from Carta) and applies a geographic multiplier based on cost of living. The current model uses two bands, high cost of living locations receive 100% of the SF benchmark; all others receive 90%. Buffer determines which band applies using Numbeo’s cost-of-living index.
Pros: the formula is intuitive enough for any employee to verify their own salary. Cost-of-living data is publicly available, so band placement feels less arbitrary than tier assignment. Works well when talent markets in your target countries are thin and competitor salary data is hard to get.
Cons: cost-of-living indices measure consumer prices, not talent competition. A company hiring software engineers in Warsaw is competing with SAP, Goldman Sachs, and well-funded Polish tech companies, none of which are pricing roles off Numbeo. A purely cost-of-living formula can leave you underbidding in competitive markets even when the cost of living there is in fact lower.
3. Market-Rate Anchored (EOR Platform Approach)
Employer-of-record platforms such as Remote.com and Deel benchmark compensation to local market rates per role, pulled from regional salary surveys, rather than adjusting from a single HQ anchor. This is the approach taken when companies hire without local entities and need a locally defensible offer in each country.
Pros: the most competitive approach in each local market. Offers are anchored to what candidates in that location actually compare them against.
Cons: the most expensive to build and maintain. Internal equity becomes difficult when two people in the same role sit on entirely different compensation philosophies because their markets drove different results. Budget modelling is harder because each location operates on its own logic.
The Data Inputs HR Teams Use to Build Bands
No single data source builds a complete pay band. The inputs below each answer a different question, and you need at least three of them before you can set a number with confidence.
| Data Input | What It Measures | Common Sources |
|---|---|---|
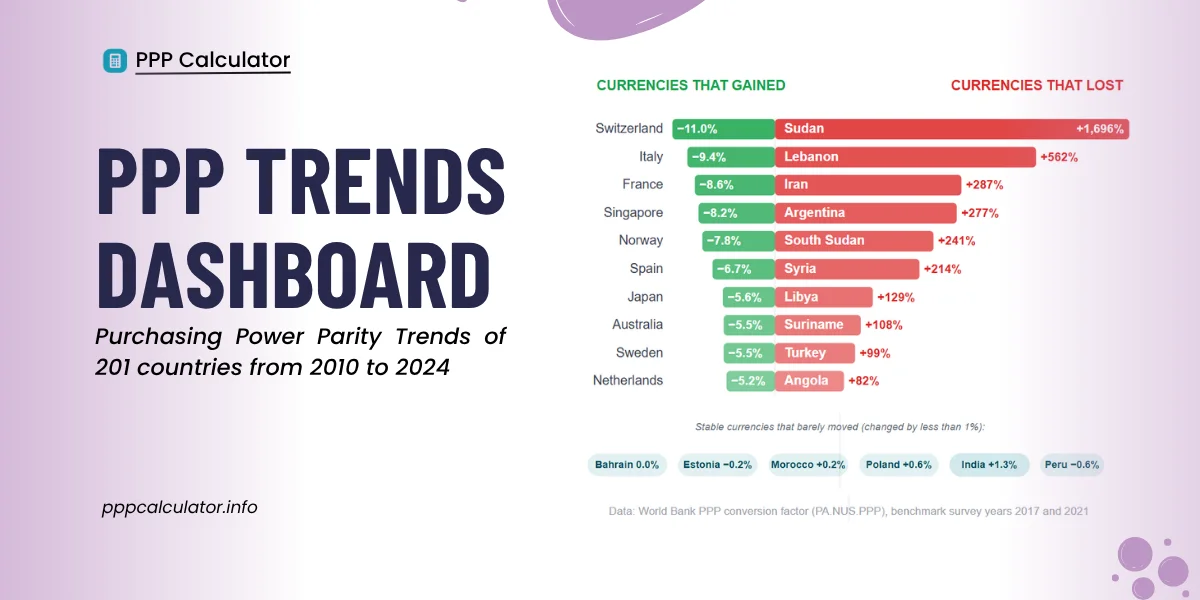
| Purchasing Power Parity | Real cost of living across countries | PPP Calculator (World Bank ICP data) |
| Local Market Salaries | What competitors pay per role | Radford, Mercer, Glassdoor, Levels.fyi |
| City-Level Cost Data | Rent, food, transport granularity | Numbeo, Expatistan |
| Tax and Net Pay | Take-home after local deductions | Government tax authority sites |
PPP data is the neutral, defensible starting point before you layer market data on top. It answers the baseline question: what salary in this country gives the same purchasing power as your anchor salary at home? pppcalculator.info draws directly from World Bank ICP data, the same source the IMF and most economists use, and covers 196 countries.
Here’s what that looks like in practice for an $80,000 USD anchor salary:
| Country | PPP Equivalent Salary | USD Equivalent | Purchasing Power vs. US |
|---|---|---|---|
| Poland | PLN 155,953 | ~$39,000 | 52% lower |
| Portugal | EUR 41,279 | ~$45,000 | 48% lower |
| India | INR 16.3 lakhs | ~$19,500 | 80% lower |
These figures, drawn from 2024 World Bank ICP data, show the minimum salary needed in each country to match the purchasing power of $80,000 in the United States. The USD equivalent column shows what each local currency amount converts to at current exchange rates.
Poland’s floor of PLN 155,953 converts to roughly $39,000, less than half the anchor salary, yet it buys the same day-to-day lifestyle as $80,000 in a US city. That gap between the exchange rate number and the purchasing power number is precisely why exchange rates mislead compensation decisions and PPP doesn’t.
The PPP figure is your floor. It tells you what the employee needs to maintain equivalent buying power. Local market data tells you whether that floor is competitive enough to actually win the hire. The higher number wins.
Step-by-Step: Building Your First Geographic Pay Band

Step 1: Define Your Anchor Country
Start with your HQ location or wherever your largest employee concentration sits. Every other band will be calculated relative to this baseline.
Use 50th percentile salary data for each role in the anchor market from a reputable survey source.
Step 2: Run PPP Conversions for Every Hiring Location
Put your anchor salary through a PPP calculator for each country where you plan to hire. This gives you the purchasing power floor: the minimum salary in that country to match your anchor market’s real living standard. pppcalculator.info covers all 196 countries and takes about 30 seconds per calculation.
Step 3: Layer Local Market Data
Pull Radford, Mercer, or Glassdoor data for each target role in each location. Compare the market rate against the PPP floor from Step 2. Where local market rates exceed the PPP floor, the market rate sets your geographic pay bands midpoint.
Where PPP exceeds local market data, investigate before assuming the market data is right, especially in fast-moving tech markets where published surveys often lag actual offers by 12 to 18 months.
Step 4: Set Your Band Width
A typical band runs 15 to 20% above and below the midpoint. Entry-level roles use tighter bands because there’s less variation in output; senior and specialist roles use wider bands to capture experience range. A senior engineering role in Germany might run EUR 63,000 to EUR 85,000. An entry-level analyst role in Portugal might run EUR 28,000 to EUR 36,000.
Step 5: Group Into Tiers (If Hiring in 10 or More Countries)
Once you’re hiring in 10 or more countries, maintaining individual bands for each becomes operationally painful. Group countries with similar PPP profiles and market rates into 3 to 5 zones. Western Europe, Central and Eastern Europe, and South Asia as separate zones is a workable starting structure for many tech companies.
Countries that sit at zone boundaries (Poland and Germany, for example, where the market gap has been narrowing) should be reviewed individually rather than assigned automatically.
Step 6: Document Your Methodology
Write down how you built the geographic pay bands before you share any offers. This is the document your People Ops team will need when an employee asks how their salary was calculated.
It should explain which data sources you used, how you defined your anchor, and how you assign countries to tiers. It doesn’t need to be public like Buffer’s, but it needs to exist. The absence of documentation is what turns a compensation question into a grievance.
Common Mistakes to Avoid
Too many tiers. More than 5 or 6 zones in a geographic pay bands system creates boundary disputes at every tier edge and makes the system feel arbitrary. If a candidate in Lyon and a candidate in Paris end up in different tiers, you need a very good explanation for why. Most companies don’t have one.
No update cadence. PPP ratios shift as inflation and economic conditions change. Local talent markets can move significantly within a year in fast-growing tech hubs. Build an annual geographic pay bands review into your compensation calendar, with mid-year triggers for markets experiencing unusual inflation.
Argentina and Turkey are the clearest recent examples: companies with annual-only review cycles found their bands practically meaningless within months as local inflation outpaced any adjustment schedule.
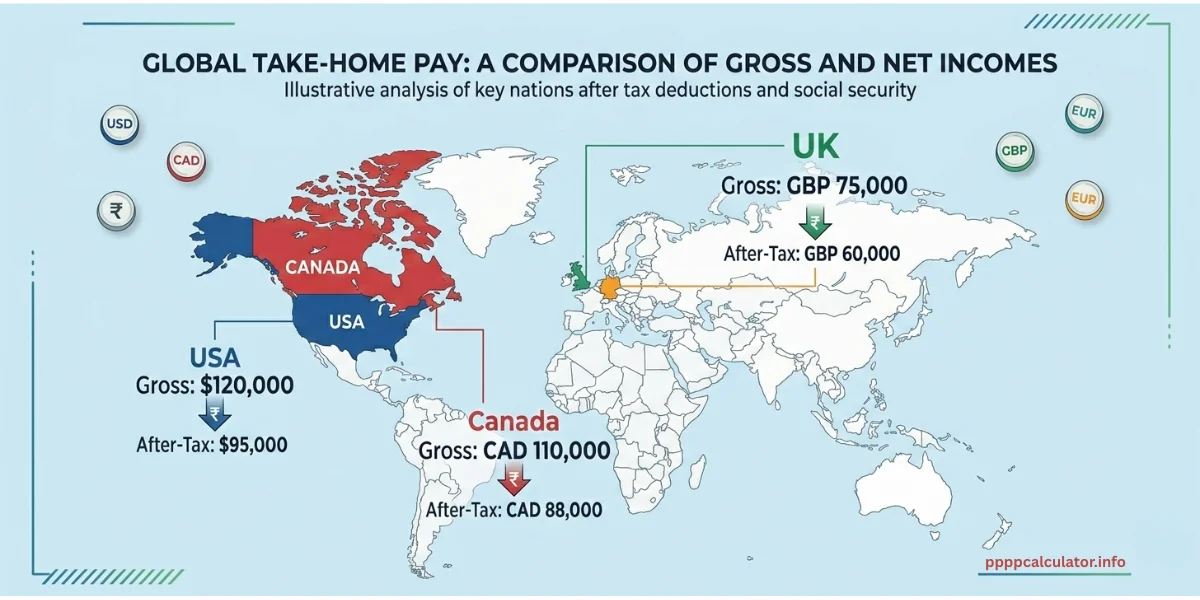
Communicating gross figures without acknowledging tax. PPP data and market survey data are gross salary figures, and so are the numbers inside your geographic pay bands. Employees compare net pay. A candidate offered EUR 70,000 in Germany is taking home roughly EUR 42,000 to 45,000 after taxes and social contributions.
If your band documentation doesn’t acknowledge this, the candidate who expected to take home EUR 70,000 feels misled on day one, and you’ve created an avoidable trust problem.
How to Communicate Pay Bands to Your Team
The minimum transparency standard is methodology disclosure. Explain the framework without publishing individual numbers. Employees want to know two things: whether the system is fair and how it was decided. A clear explanation of your anchor, your data sources, and your tier logic answers both questions without exposing individual compensation.
Geographic pay bands aren’t about paying people less where costs are lower. They’re about making sure a salary actually covers a comparable standard of living wherever your team works. That reframe moves the conversation from “you’re cutting my pay” to “this is designed so the money means the same thing everywhere.”
A practical tool that makes all of this easier, a one-page compensation philosophy document. It should cover what data sources inform your bands, how location factors are determined, and when bands are reviewed. It takes two hours to write and saves considerably more time in individual conversations over the course of a year.
Conclusion
Geographic pay bands aren’t about distributing less to employees in lower-cost markets. They’re about making sure compensation means the same thing wherever someone on your team lives and works. The companies that build these systems well share one habit, they start from data, not intuition, and they document every decision before the first offer goes out.
Before you open a spreadsheet or define a single zone, establish your purchasing power baseline. Run your anchor salary through the PPP Calculator at pppcalculator.info, built on 2024 World Bank ICP data, to get purchasing power equivalents for every country you’re hiring in.
From there: layer market data, set your bands, document your methodology, and communicate it clearly. The system doesn’t need to be perfect. It needs to be principled, consistent, and reviewable. That’s what defensible global compensation actually looks like.
Geographic Pay Bands – FAQ
No. The job description and role expectations stay identical. Only the salary range changes based on location. The same role in two countries should carry the same responsibilities, level, and career path, with the band adjusted for each market.
At minimum annually, with a defined trigger for mid-year reviews in countries experiencing inflation above 8% or significant shifts in local tech hiring. Markets like Poland and India have seen enough movement in recent years that an annual-only review cycle has left some companies with off-market bands.
Other Useful articles:

Jitender is the founder and lead developer of PPPCalculator.info. He created this free tool to bridge the gap between currency conversion and real purchasing power, helping professionals across 50+ countries make informed salary decisions. He regularly translates complex World Bank and OECD data into practical guides for remote workers and expats.